Figure 1.

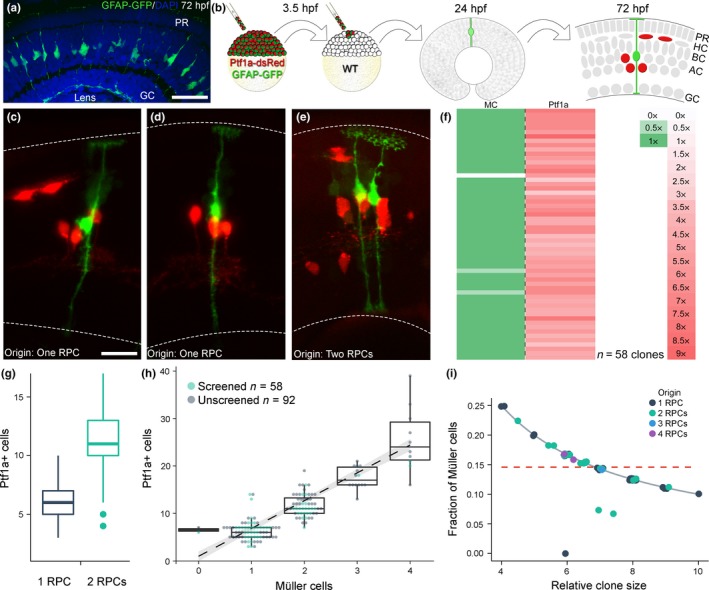
Correlation between retinal progenitor cells and Müller cells. (a) Sections of GFAP‐GFP transgenic retinas were counterstained with DAPI and quantified. (b) Transgenic blastomeres were transplanted into wild‐type embryos to generate labelled clones. (c–e) Clones originating from one or two RPCs, scored at 24 hpf, and imaged at 72 hpf. Dashed lines mark the limits of the retina. (f) Clones generated by RPCs scored at 24 hpf normalized to the number of start RPCs. (g) Distribution of Ptf1a lineage in clones originating from one or two RPCs. (h) Correlation between Müller cells and Ptf1a‐positive cells within a clone. (i) The fraction of MCs compared to the clone size (i.e., MCs/(MCs+Ptf1a‐positive cells)) follows the curve expected for a deterministic fate assignment rather than the one expected by a stochastic model (dotted line). Scale bar represents 20 μm in a and 10 μm in c–e. [Colour figure can be viewed at wileyonlinelibrary.com]
