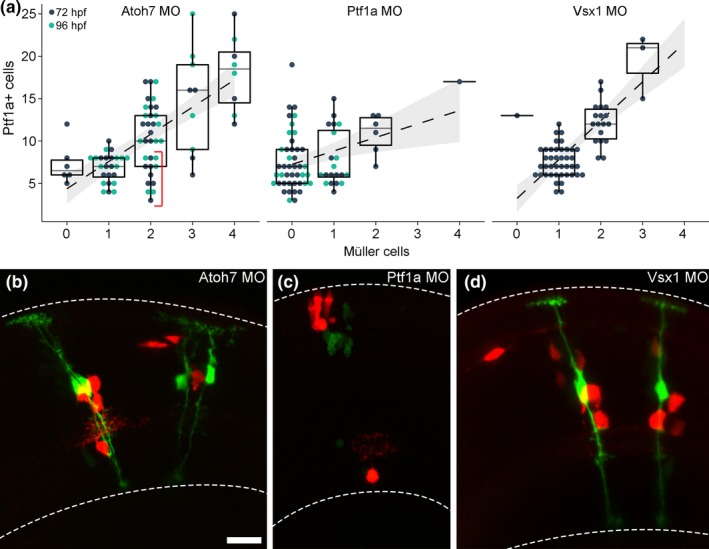
Figure 2.

Formation of Müller cells in morphant clones. (a) Clone data where Atoh7, Ptf1a, or Vsx1 was knocked down using morpholinos. Data display the correlation between Müller cells and Ptf1a‐positive cells within a clone. Red bracket in Atoh7 morphant graph features a cluster of clones hosting two MCs predicted to have originated from a single RPC. (b) Two Atoh7 morphant clones, containing two MCs each, predicted to have originated from single RPCs based on the number of Ptf1a‐positive cells. (c) A Ptf1a morphant clone where the number of fate‐shifted red cells suggests that the clone originated from a single RPC. (d) Two Vsx1 morphant clones. Dashed lines mark the limits of the retina. Scale bar in b represents 10 μm and is also valid for c and d. [Colour figure can be viewed at wileyonlinelibrary.com]
