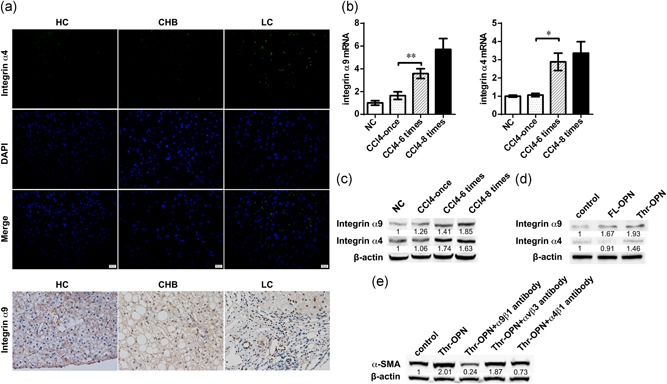
Figure 5.

Thr‐OPN activated HSCs by α9 and α4 integrins that presented high expressions in liver fibrosis. (a) α4 and α9 integrin expression in liver from healthy control (HC) individuals, patients with chronic hepatitis B (CHB), and liver cirrhosis (LC, original magnification, 400×). (b) α9 and α4 integrin mRNA expressions in the liver in a CCl4‐induced progressive liver fibrosis mouse model. (c) α9 and α4 integrin protein expressions in the liver in the mouse model. (d) The expression of α9 and α4 integrin protein in LX‐2 cells after stimulation with Thr‐OPN or FL‐OPN. (e) The expression of α‐SMA protein in Thr‐OPN‐stimulated LX‐2 cells after administration of blocking antibodies to integrin α9β1, ανβ3, and α4β1. *p < 0.05; **p < 0.01. CCl4: carbon tetrachloride; FL‐OPN: full‐length osteopontin; HSC: hepatic stellate cell; Thr‐OPN: thrombin‐cleaved osteopontin; α‐SMA: alpha‐smooth muscle actin [Color figure can be viewed at wileyonlinelibrary.com]
