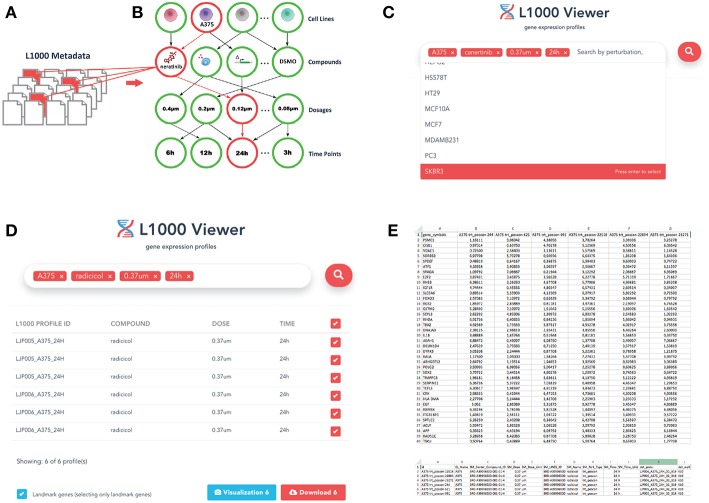
Figure 1.
Overview of the L1000 Viewer. (A) Individual files forming the LINCS data. (B) Our graph database inferred from the relations among the individual profiles. (C) The interface allowing to enter queries to search the graph database. Shown is an example query discussed in the text. (D) The result of a query leads to a downloadable list. (E) Gene expression and metadata csv files.

