
Figure 4.
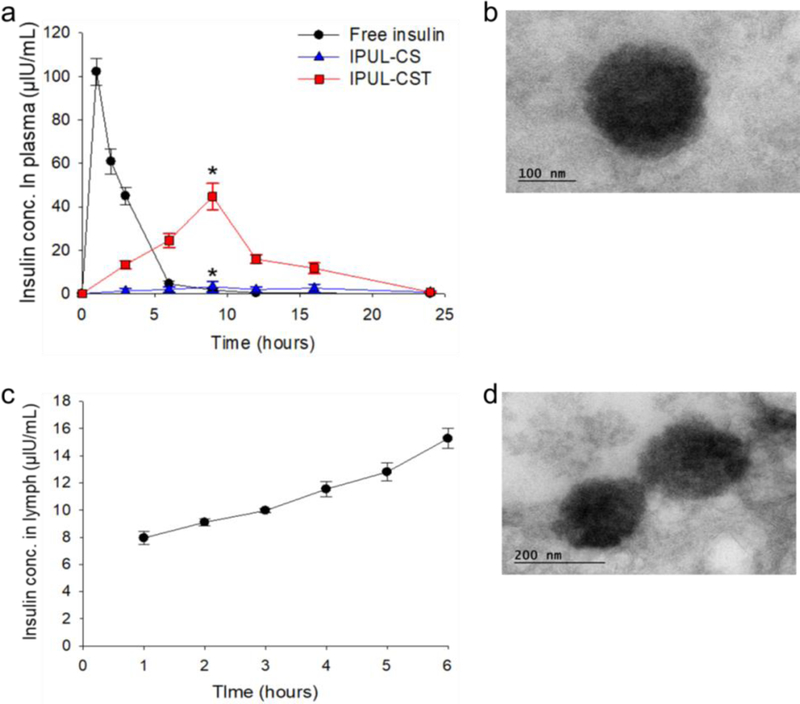
a) Plasma insulin level versus time profiles of T1DM SD rats. Free insulin (5 IU/kg) was administered by SC injection. IPUL-CS (20 IU/kg) and IPUL-CSG (20 IU/kg) were administered o.g. (n=5). *P < 0.001. b) TEM images of IPUL-CST in plasma at 6 hours post-administration o.g. with 20 IU/kg of IPUL-CST into SD rats. c) Lymph insulin concentration versus time profiles in fistula SD rat model (n=3). c) TEM images of IPUL-CST in cisterna chyli at 6 hours post-administration o.g. with 20 IU/kg of IPUL-CST into SD rats.