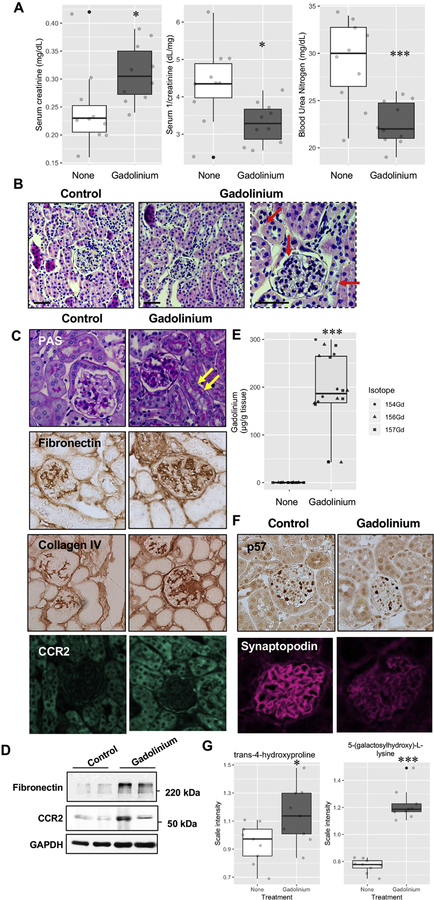
Figure 2.
Gadolinium impairs renal function conco mitant with pathologic changes in the kidney. A. Plasma was obtained from untreated and contrast-treated (2.5 mmol/kg intraperitoneally, 20 doses over 4 weeks) mice without renal insufficiency at the endpoint. B. Gadolinium-based contrast agents induce proximal tubular vacuolization, mesangial hypercellularity, and tubular damage (arrows). H&E, calibration bars = 0.05 mm. C. Glomerular pathology in gadolinium-treated mice. Arrows indicate proximal tubular vacuolization. PAS, immunohistochemistry for fibronectin, immunohistochemistry for collagen type IV, and immunofluorescence for CCR2; 400 _. D. Gadolinium induces elevated fibronectin and CCR2 in the renal cortex. Immunoblot. E. Treated mice demonstrated the accumulatio n of gadolinium. Inductively-coupled plasma mass spectroscopy. F. The effect of gadolinium on the podocyte markers p57 (immunohistochemical stain) and synaptopodin (immunofluorescence); 400 _. G. Biomarkers derived from metabolomic assay of flash-frozen kidney tissue from untreated and gadolinium (Gd) -treated groups, n = 9 each. Boxes represent upper and lower quartile limits, + mean, —— median, whiskers the maximum and minimum of the distribution, *, P < 0.05, *** P < 0.001 by t-test.

