Figure 7.

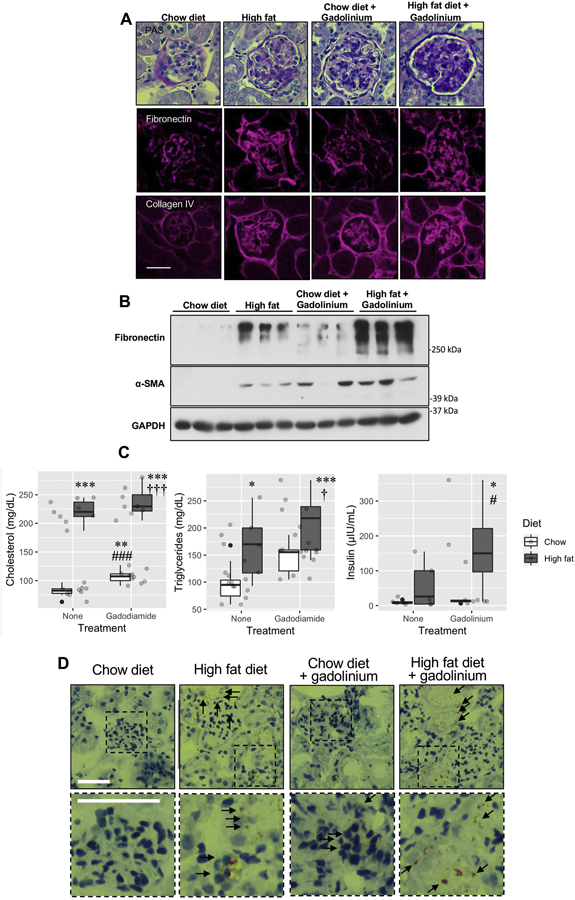
Obesity amplifies gadolinium-based contrast agent-induced kidney injury. A. Renal fibrosis from gadolinium-based contrast agents, obesity, and the combination of the two. Upper panels, PAS, 400 ×. Middle panels, fibronectin. Immunofluorescence, 400×. Lower panels, collagen IV. Immunofluorescence, 400×; calibration bar = 0.05 mm. B. Quantitation of fibrotic markers. Immunoblot. C. Plasma lipid profiles and insulin levels. * P < 0.05, ** P < 0.01, *** P < 0.001 from untreated, chow diet; # P < 0.05, ### P < 0.001 from untreated, high-fat diet; † P < 0.05, ††† P < 0.001 from gadolinium-based contrast agent-treated, chow diet group by analysis-of-variance and Tukey honest significant difference post-hoc testing. D. Renal cortex, with arrows indicating lipofuscin-stained cells. Oil red O, 400_, calibration bars = 0.05 mm.
