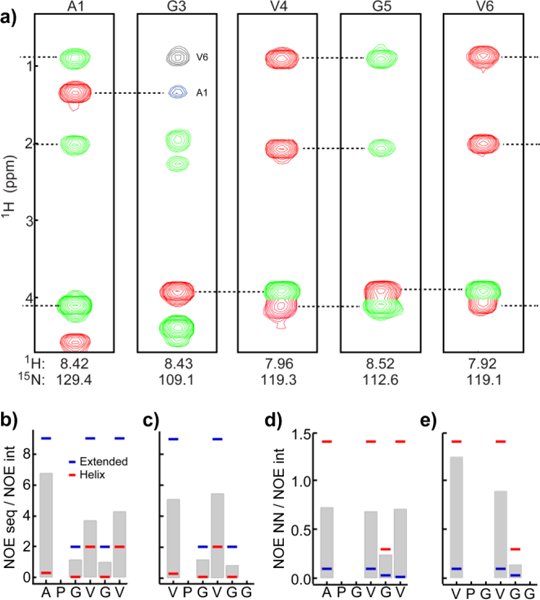
Figure 4.

Average interproton distance in hydrophobic domains. (a) Strip plots from the 3D 15N-edited NOESY HSQC spectrum of 2 at selected residues. Intra-residue NOEs (red) were identified in the 3D 15N-edited TOCSY HSQC spectrum. Sequential NOEs from the residue before are colored green and longer-range correlations are colored blue or black. Observed NOE ratios NOEseq/NOEint (b, d) and NOENN/NOEint (c, e) are gray bars. Benchmark NOE ratios are indicated for α−helix (red) and β−sheet (blue).
