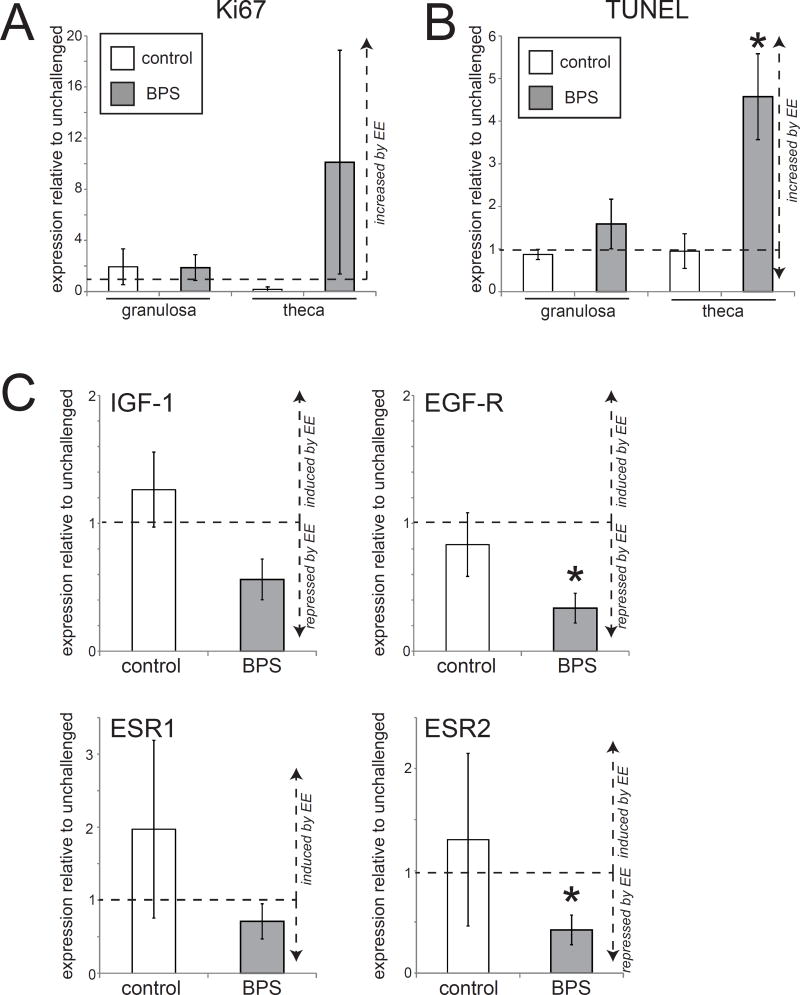
Figure 8. Significant alterations in apoptosis and gene expression in the ovary of BPS-treated females after an estrogen challenge.
A) Quantification of Ki67 in the ovary of control+EE and BPS+EE females after an estrogen challenge. B) Quantification of TUNEL in the ovary of control+EE and BPS+EE females after an estrogen challenge. C) An estrogen challenge decreased the expression of estrogen-sensitive genes in the ovaries of BPS+EE females. In all panels, * indicates p<0.05, independent samples t-test comparing EE-challenged with non-challenged females from the same perinatal treatment group (control or BPS). δ indicates significant differences, p<0.05, between control+EE and BPS+EE females. In all groups, n=5 per treatment.

