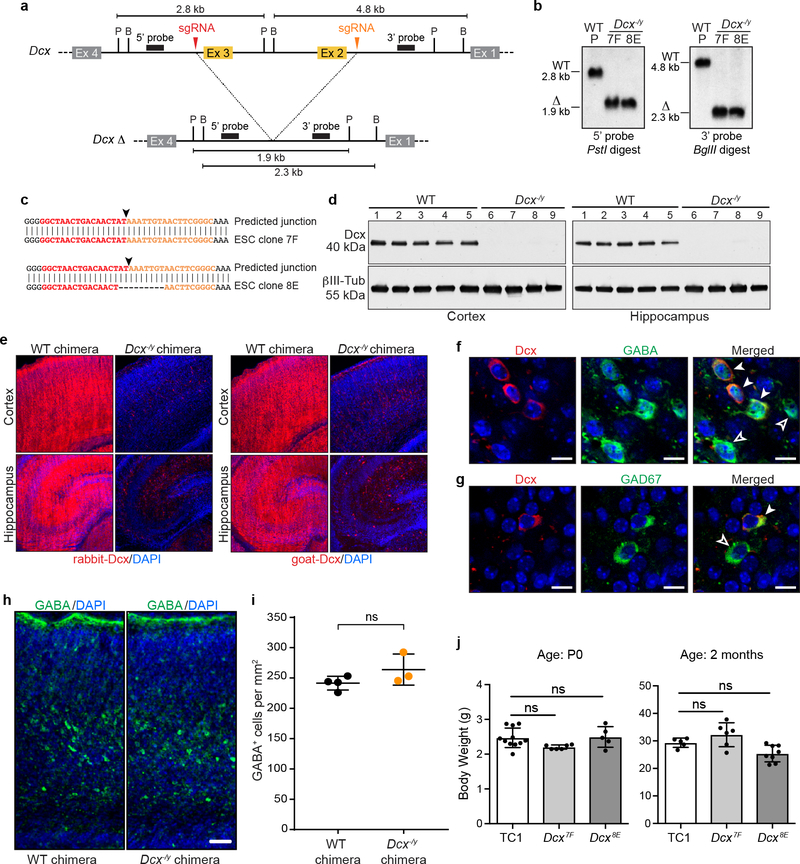
Extended Data Figure 7. Generation of Dcx−/y NBC chimeras.
a, Upper, Schematic of Dcx inactivation. sgRNA target sequences (red and orange arrowheads) flanking exon 2 (Ex 2) and exon 3 (Ex 3) are indicated. Probes (black rectangles) and restriction enzyme sites (P, PstI; B, BglII) used for Southern blotting are indicated. Predicted restriction fragment sizes are indicated in kb. Lower, predicted Dcx exon 2/3 deletion (Δ) locus. b, Southern blot analysis of genomic DNA from parental Dcx+/y (WT) ESC line and Dcx−/y ESC clones 7F and 8E using the probes and digests depicted in a. Southern blot analysis was performed five times. c, Sequence analysis of Dcx deletion junctions (black arrowheads); sgRNA target sequences flanking the deletion junction are denoted in red and orange. Both Dcx−/y ESC clones have unique junction sequences, suggesting each derived from an independent deletion event. d, Western blotting of whole cell lysates from cortex (left) or hippocampus (right) of WT or Dcx−/y NBC chimeras at P0 with antibodies to Dcx (rabbit anti-Dcx) and βIII-tubulin as a loading control. Each lane (1–9) depicts cortex or hippocampus whole cell lysate from one mouse; experiments were performed on nine mice (n=4, Dcx−/y ESC clone 8E; n=5, wild-type ESCs) e, Representative immunofluorescence images of Dcx expression in cortex (upper) and hippocampus (lower) of P0 WT or Dcx−/y chimeras. 21 mice (n=6, Dcx−/y ESC clone 7F; n=4 Dcx−/y ESC clone 8E; n=11 wild-type ESCs) were analyzed. Dcx-expressing cells (red) were detected with rabbit (left) or goat (right) Dcx antibodies. Nuclei were DAPI stained (blue). f, Representative images of somatosensory cortical brain sections (acquired between layers IV-V) from P0 Dcx−/y chimeras co-stained Dcx (red, left) and GABA (green, middle) antibodies. Merged images are shown on right. Nuclei were DAPI stained (blue). Solid white arrowheads indicate Dcx/GABA double-positive cells (host-derived immature interneurons). Hollow arrowheads indicate GABA single-positive cells (either donor-derived mature interneurons, donor-derived immature interneurons, or host-derived mature interneurons). g, Representative images of somatosensory cortical brain sections (acquired between layers IV-V) from P0 Dcx−/y chimeras co-stained with Dcx (red, left) and GAD67 (green, middle) antibodies. Merged images are shown on right. Nuclei were DAPI stained (blue). Solid white arrowheads indicate host-derived immature interneurons, whereas hollow arrowheads indicate cells that are either donor-derived mature interneurons, donor-derived immature interneurons, or host-derived mature interneurons. Scale bar, 10 μm. For experiments in f and g, nine mice (n=4, Dcx−/y ESC clone 8E; n=5 wild-type ESCs) were analyzed. h, Representative images of somatosensory cortical brain sections from P0 WT and Dcx−/y chimeras stained GABA antibodies (green). Nuclei DAPI stained (blue). Scale bar, 50 μm. Seven mice were analyzed (n=3, NBC chimeras; n=4, conventional chimeras). i, Cell density of GABA-positive interneurons in somatosensory cortex from control chimeras (n=4 mice) and Dcx−/y chimeras (n=3 mice). Center denotes mean, error bars indicate SEM. ns, not significant, P>0.05 (unpaired, two-tailed t test). j, Mean (± SD) body weights of WT (TC1) or Dcx−/y chimeras; ns, not significant, P>0.05 (one-way ANOVA, Tukey’s post hoc correction). For P0 cohort, n=6 for Dcx7F; n=5 for Dcx8E; n=11 for WT TC1 controls. For two-month-old cohort, n=6 for Dcx7F; n=8 for Dcx8E; n=5 for WT TC1 controls.

