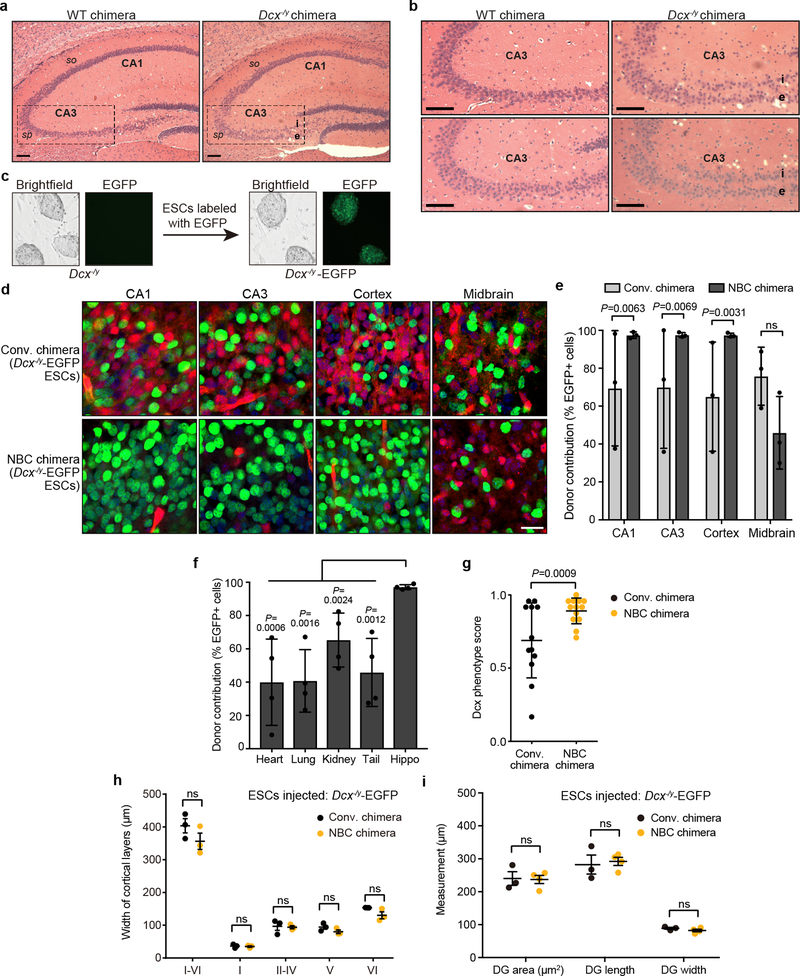
Extended Data Figure 8. Dcx−/y NBC chimeras show a mutant hippocampal phenotype.
a, Representative images of H&E-stained coronal sections of hippocampus from 2-month-old wild-type (WT) chimeras and Dcx−/y chimeras. Dashed lines highlight the CA3 region, where the stratum pyramidale (sp) is present as a single layer in WT chimeras (left) but is abnormally divided into an internal (i) and external (e) layer in the Dcx−/y chimeras (right). Refer to Figure 4a for a schematic of the hippocampus. so, stratum oriens. b, Enlarged, representative images of the CA3 region in two 2-month-old WT and Dcx−/y chimeras. Scale bars, 100 μm. For experiments in a and b, 14 two-month-old Dcx−/y chimeras, generated from two different Dcx−/y ES clones (n=6 from clone Dcx7F; n=8 from clone Dcx8E), and five WT chimeras were analyzed. All 14 Dcx−/y chimeras showed the hippocampal mutant phenotype. c, Representative bright field and fluorescence microscopy images of Dcx−/y ESCs before and after lentiviral integration of H2B-EGFP. d, Representative images from experiments performed on 6 mice (n=3, NBC chimeras; n=3, conventional chimeras) showing extent of Dcx−/y-EGFP donor ESC contribution to indicated brain regions in P0 conventional and NBC chimeras (green, donor ESC-derived cells; red, host-derived cells; blue, DAPI-stained nuclei). Scale bar,10 μm. e, Quantification of Dcx−/y-EGFP donor ESC contribution in conventional and NBC chimeras (n=3 mice each). Data are mean ± SD. Variance was significantly different between conventional and NBC chimeras for CA1, CA3, and cortex (F test for equality of variances), reflecting the wide variation in donor contribution among individual conventional chimeras in contrast to consistently high donor contribution in NBC chimeras. No difference was observed for midbrain (ns, not significant; P = 0.7812), consistent with competition between donor and host cells in this non-ablated brain region in both types of chimeras. f, Quantification of variance in Dcx−/y-EGFP donor ESC contribution in non-brain tissues relative to hippocampus in NBC chimeras (n=4). Donor contribution in the hippocampus was calculated as the average of CA1 and CA3 values. Data are mean ± SD (F test for equality of variances). g. Quantification of Dcx mutant hippocampal phenotype in conventional chimeras (n=12) and NBC chimeras (n=13) at P0. Dcx phenotype scores were determined by reviewing a series of coronal brain step-sections from each chimera and determining the number of sections that show a clear CA3 double layer (Score = 1), some degree of CA3 disorganization (Score = 0.5), or normal CA3 layer morphology (Score = 0). Mean Dcx phenotype scores across all sections of a given chimera are plotted. Each data point corresponds to one chimera. Horizontal lines indicate mean phenotype score (± SD) across all chimeras per group. Conventional chimeras show significant variation in the severity of the mutant phenotype, in contrast to the NBC chimeras (F test for equality of variances). h, Somatosensory cortex layer widths in P0 Dcx−/y-EGFP ESC-injected conventional (n=3, black dots) or NBC (n=3, orange dots) chimeras determined by DAPI and Ctip2 staining. Center denotes mean, error bars indicate SEM. ns, not significant, P>0.05 (two-way ANOVA with Bonferroni post hoc correction for multiple comparisons). i, Dentate gyrus (DG) measurements in conventional chimeras (n=3; black dots) and NBC chimeras (n=4; orange dots) at P0, generated by blastocyst injection of Dcx−/y-EGFP ESCs. Horizontal bars indicate mean; Error bars denote SEM; ns, not significant, P>0.05 (unpaired, two-tailed t test).

