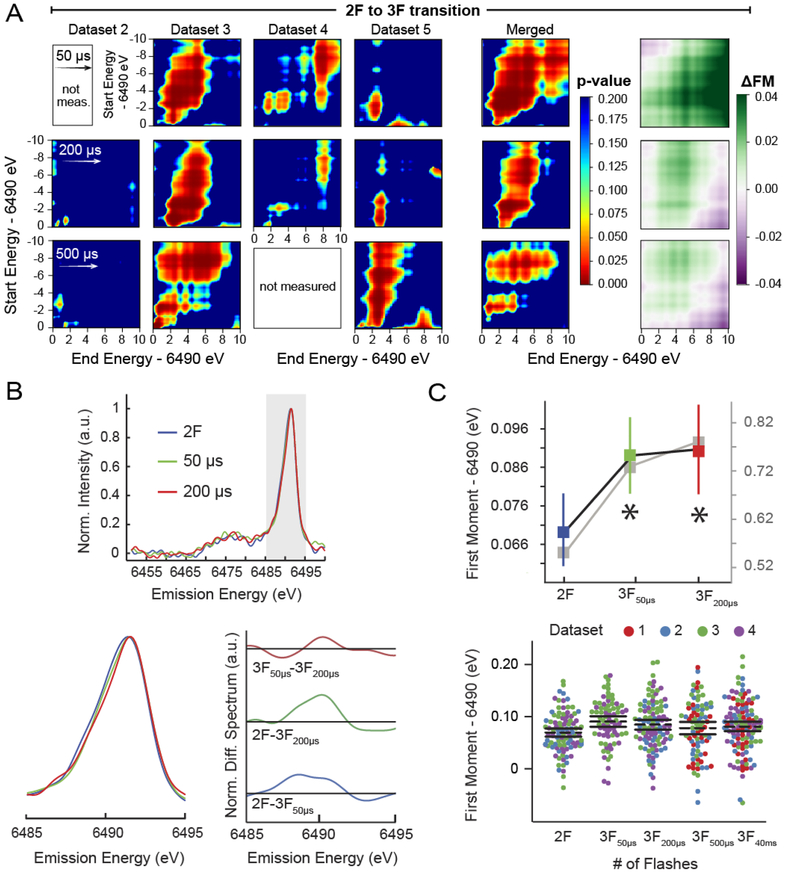
Figure 3. Rapid onset of spectral changes observed during the S3 to S0 transition.
(A) Spectral shifts occurring as a result of the 2F→3F transition are characterized using 2-D heatmaps colored by p-value (see Table S2 for n), for changes to first moments calculated over the ranges defined by the x and y axes, i.e. start and end energy, respectively. Strong contours are consistently observed indicative of a statistically significant spectral change. The directionality and magnitude of spectral shifts occurring with these transitions are also shown as 2-D heatmaps, which graphically illustrate the change in first moments (ΔFM=FMpost-flash-FMpre-flash) calculated over the ranges defined by the x and y axes. All 2F→3F comparisons yield primarily negative, or reductive, shifts. Determined p-values ~0.02 (Table 3) for the 200 μs time point are further supported by the above heatmaps, however, little information can be gleaned from these plots of dataset 2, likely due to much lower x-ray shot count, see Table 2. Although the 500 μs time point is equally compelling, the traditional energy range (6.485–6.495 keV) selected for reporting first moments does not deliver statistical significance, Table 3. (B) Wavelet transform smoothed and background subtracted emission spectra for merged 2–3F data, calculated as in Fig. 2B. (C) (left) Average first moments from unprocessed (color) and processed (grey) spectra. Errors are presented as SEM with n given in Table 2. Those moments with a statistically significant difference (p<0.05) from 2F data are indicated with an asterisk. (right) Dot plot of first moments from raw data, presented as in Fig. 2C. See Fig. S3 for 2-D plots of the 40 ms (majority S0 state) time point.

