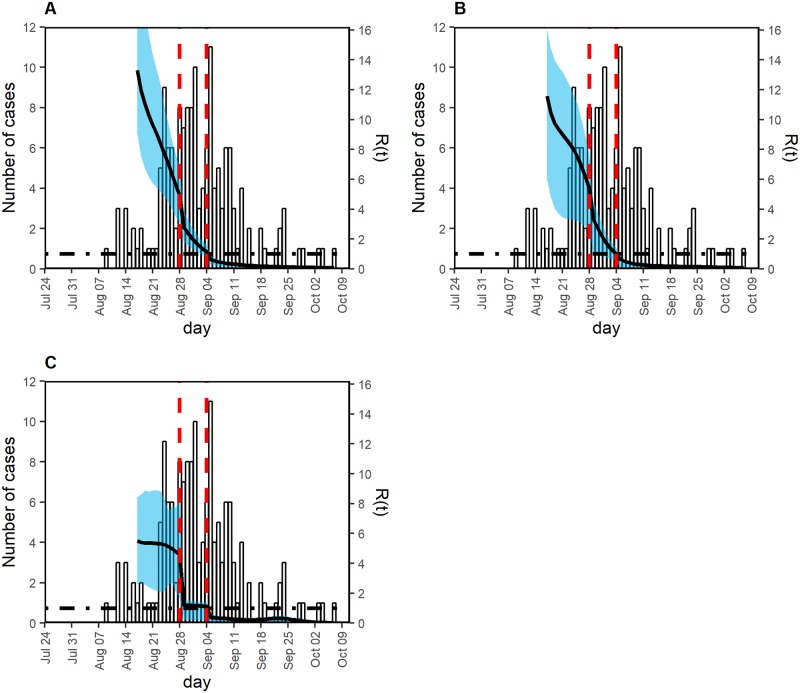
Fig 4. Effective reproduction number in three models with a different number of generations.
Left vertical axis shows the observed number of cases (i.e., incidence as a function of the date of illness onset), and the right vertical axis shows the effective reproduction number, illustrated using a black solid line. Two red vertical dashed lines indicate times at which interventions started. The earlier one (from 28 August) included mosquito control and dissemination of outbreak information via mass media. The later vertical line indicates the date on which Yoyogi Park was closed. Black dot-dashed horizontal line indicates the threshold value 1 for the effective reproduction number, below which the outbreak will eventually be controlled. The effective reproduction number was estimated, assuming three different numbers of generations of infection, i.e., (A) two, (B) three, and (C) four generations excluding generation zero. Owing to the uncertainty of estimation during the very early stage of the epidemic, the effective reproduction number was plotted from 17 August. The shaded cyan area represents the 95% confidence interval (CI) of the effective reproduction number, calculated using 100 bootstrap samples.

