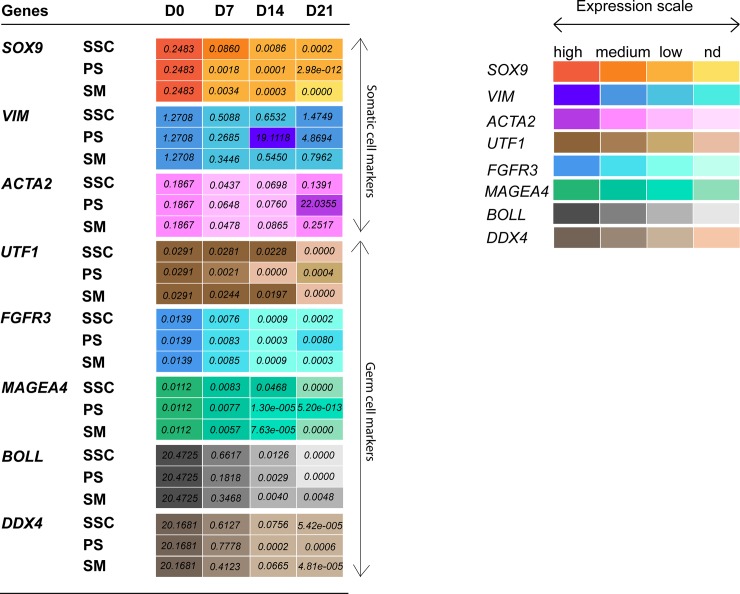
Fig 3. Heat map showing gene expression levels (2^ delta Ct values) of somatic marker genes (SOX9, VIM and ACTA2) and germ cell marker genes (UTF1, FGFR3, MAGEA4, BOLL and DDX4) relative to reference gene GAPDH of macaque testicular cells cultured in SSC, PS and SM media conditions for 21 days.
Expression scale for each marker gene represents relative gene expression levels from high to medium, low and non-detected (nd). Each box represents mean values calculated from cultured testicular cells of 4 macaque monkey samples.

