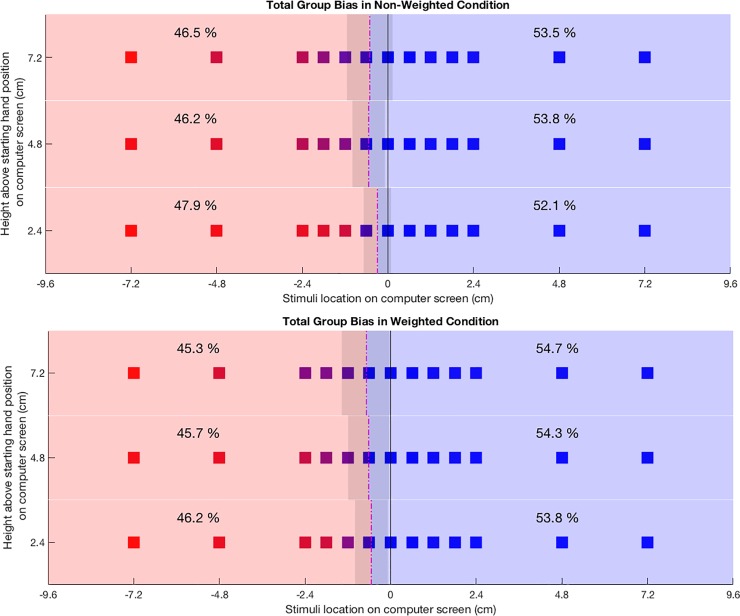
Fig 3. Average reaching frequencies and reaching frequency midline positions.
Each cube represents a stimulus location. Group means of hand selection at stimulus positions are color-coded with red squares indicating 100% left hand selection and blue squares indicating 100% right hand selection. Mean percentages of left and right hand use are presented in each hemispace. Dash-dot lines indicate mean reaching frequency midline positions with shaded areas representing their standard deviation. Upper panel: non-weighted conditions; lower panel: condition with weighted left hand glove.

