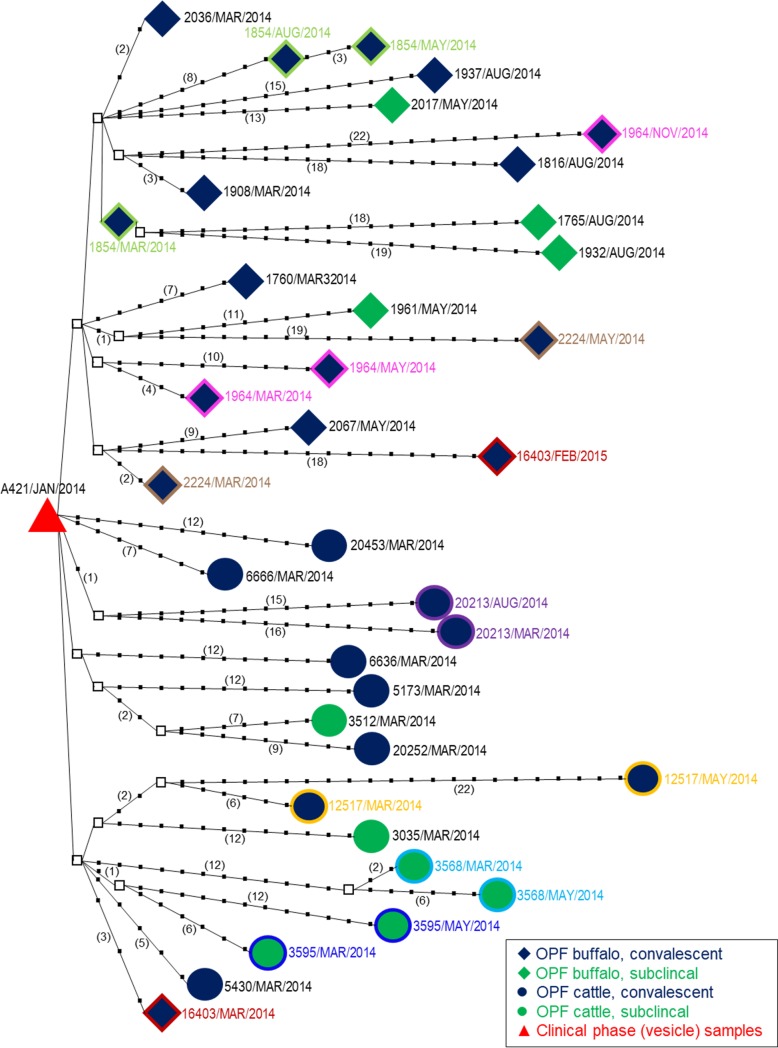
Fig 5. Statistical parsimony analysis of P1-capsid coding regions of outbreak and carrier viruses.
The analysis was implemented in TCS v 1.21. Tick marks and numbers in parentheses represent the number of nucleotide changes between the putative ancestors and the virus isolates. Internal nodes (squares) represent un-sampled intermediate sequences inferred by TCS. Coloured outlines and text denote samples from the same animal.

