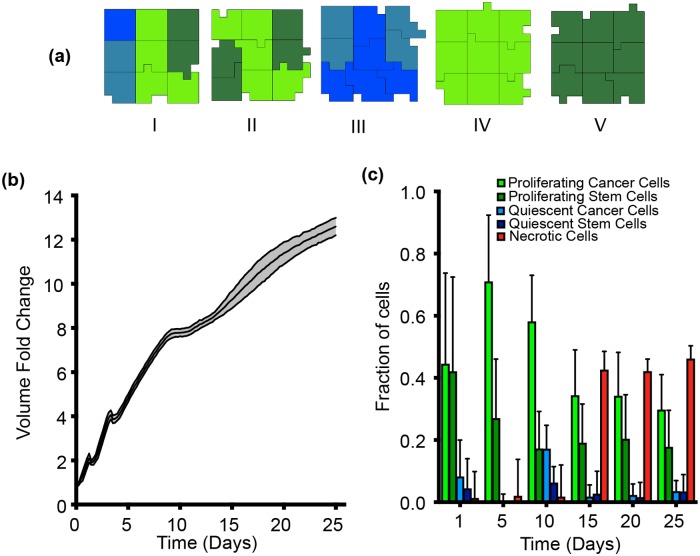
Fig 4. Model calibration.
(a) Five scenarios of initial tumor cell clusters were simulated with different combinations of cells present: (I) All four types of cells (PCancer, QCancer, PStem and QStem), (II) Only proliferating cells (PCancer and PStem), (III) Only quiescent cells (QCancer and QStem), (IV) Only proliferating cancer cells (PCancer) and (V) Only proliferating stem cells (PStem). The ratio between each cell type is randomly generated by CC3D to have a total of nine cells. (b) Model-simulated tumor growth profiles using the optimized parameter set, initiated with the five different cell cluster configurations. Ten iterations for each case were simulated. The black solid line is the mean of all 50 simulations, and the shaded grey area represents the standard deviation of the simulations. (c) Fraction of each type of cell as the tumor grows with time. The bar height is the mean value of all 50 simulations while the standard deviation is represented by the error bars. Time evolution of the number of each cell type differs for five starting cell clusters, shown in Figure B in S1 Text.

