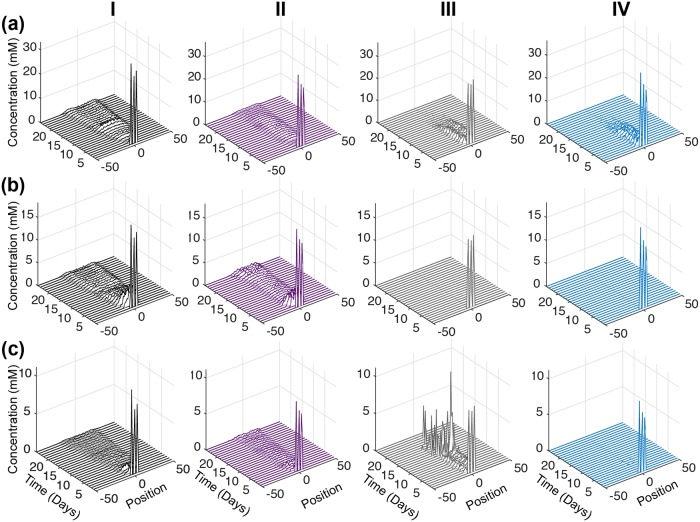
Fig 7. Intracellular response of complete inhibition.
Concentration profiles of total (a) Glucose, (b) ATP and (c) Glutamine in tumor slices along the y-axis in case of control with no inhibition (black, Column I), complete inhibition of GAPDH (purple, Column II), complete inhibition of OXPHOS (grey, Column III) and complete inhibition of ASCT2 (teal, Column IV). Each time profile is an average of 30 iterations of model simulation with the reaction velocity, Vf, of the targeted reaction set equal to zero in each case.

