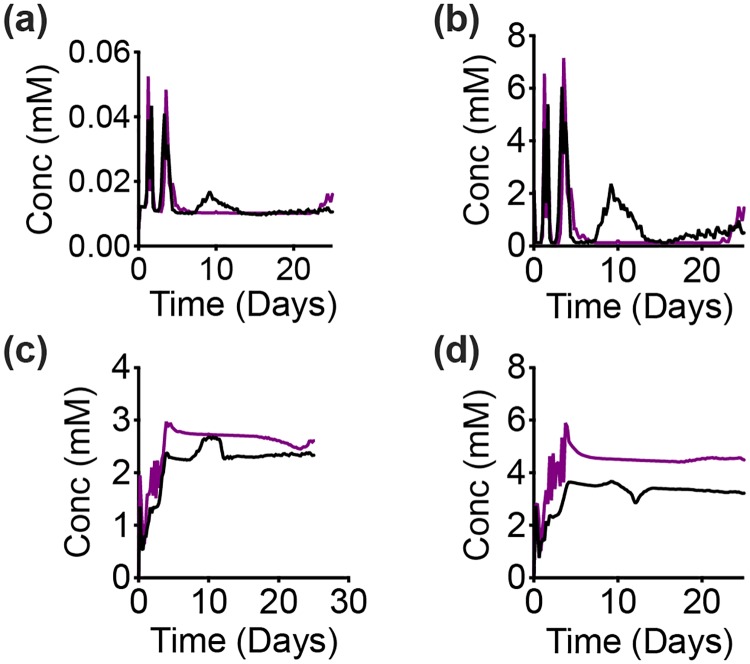
Fig 9. Intracellular response of complete GAPDH inhibition.
Spatially-aggregated concentration of intracellular metabolites: (a) Malate, (b) α-Ketoglutarate, (c) Ribose 5-phosphate and (d) Sedoheptulose-7-phosphate for complete inhibition of GAPDH (purple) compared to a control case (black). Lines are an average of 30 iterations of the model simulation.

