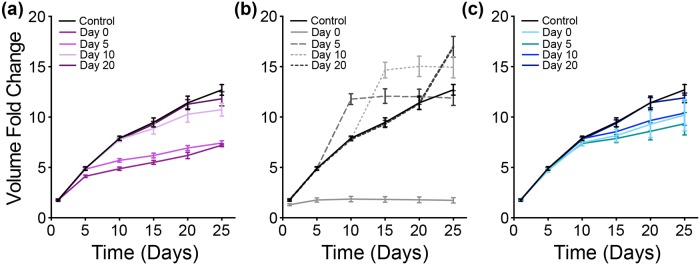
Fig 10. Metabolic perturbation II—Partial inhibition.
Fold-change in tumor volume with time-based partial inhibition of (a) GAPDH (purple), (b) OXPHOS reaction (grey) and (c) ASCT2 (teal) compared to a control case (black). The error bars represent the standard deviation between 30 iterations of model simulations for each case.

