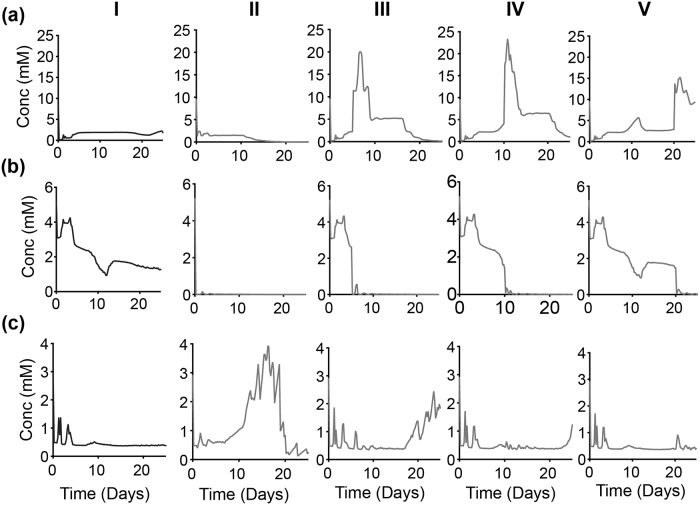
Fig 12. Intracellular response of partial time-based—OXPHOS inhibition.
Spatially-aggregated concentration of intracellular metabolites: (a) Glucose, (b) ATP and (c) Glutamine. (Column I) No inhibition. With OXPHOS inhibition at various times: (Column II) zeroth day, (Column III) 5th day, (Column IV) 10th day and (Column V) 20th day. Lines are an average of 30 iterations of the model simulation. For each iteration, the reaction velocity is taken from a Gaussian distribution based on the original velocity Vf, with a mean value of 0.1 * Vf and a standard deviation of 0.2 * Vf.

