
Figure 7.
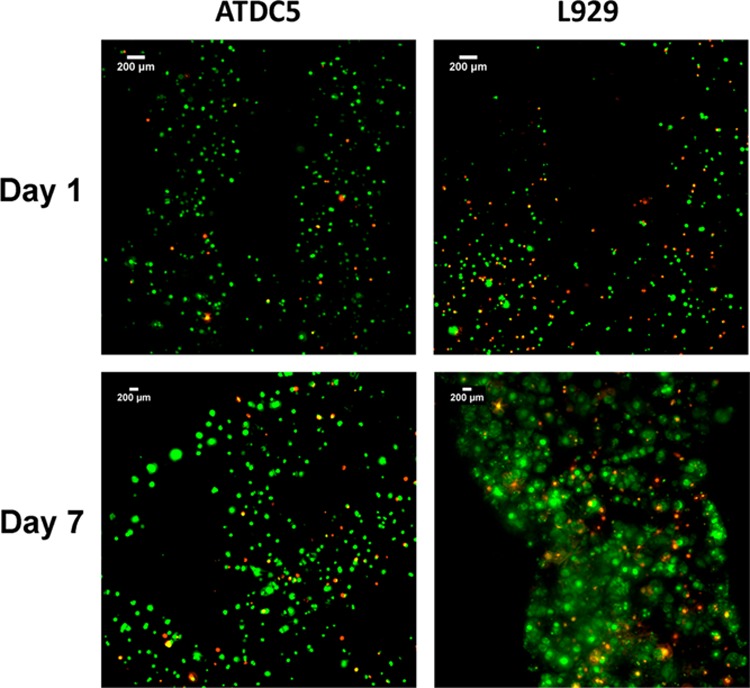
Viability of ATDC5 and L929 cells in bioprinted scaffolds over day 1 and 7. Green stain represents live cells and red stain represents dead cells. ATDC5 scaffolds were bioprinted at 5 mm/s with 30 kPa pressure, and L929 scaffolds were bioprinted at 10 mm/s with 30 kPa pressure.