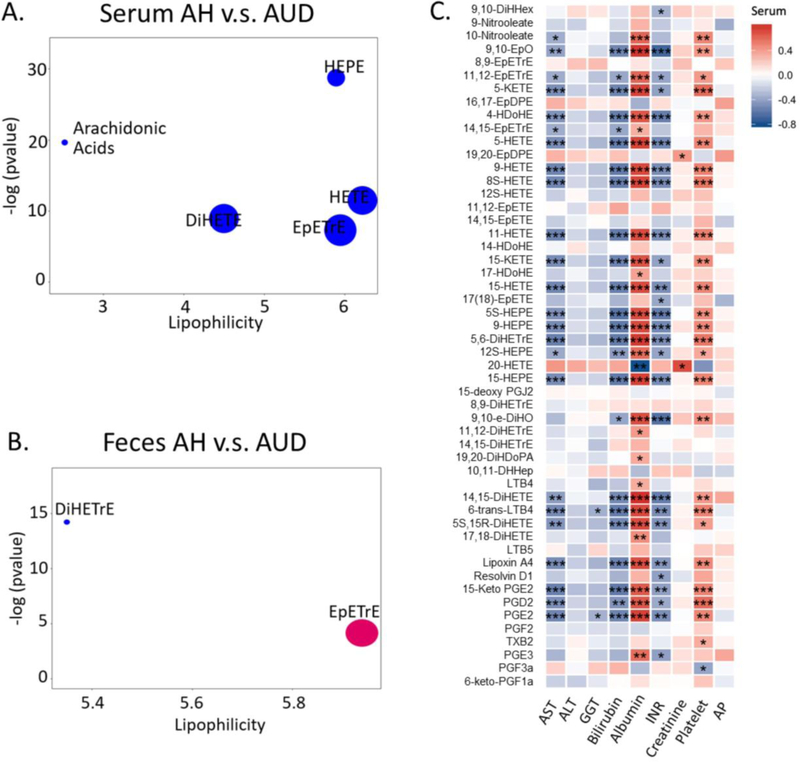
Figure 6.
ChemRICH analysis of serum oxylipins in alcoholic hepatitis and alcohol use disorder patients (A). AUD: alcohol use disorder; AH: alcoholic hepatitis. Significantly impacted metabolite clusters are shown in the plot (p<0.05). The y-axis shows the most significantly altered clusters on the top. Red=increased in AH patients. Blue=decreased in AH patients. ChemRICH analysis of fecal oxylipins in alcoholic hepatitis and alcoholic use disorder (B). AUD: alcohol use disorder; AH: alcoholic hepatitis. Significantly impacted metabolite clusters were shown in the plot (p<0.05). The y-axis shows the most significantly altered clusters on the top. Red=increased in AH patients. Blue=decreased in AH patients. Purple=some increased compounds, others decreased in AH patients. Spearman correlation of serum oxylipins with laboratory parameters in alcohol use disorder and alcoholic hepatitis patients (c). Color intensity represents the correlation coefficient (R); Red: positive correlation. Blue: negative correlation. * p<0.05, ** p<0.01, *** p<0.001. INR, international normalized ratio; ALT, alanine aminotransferase; AST, aspartate aminotransferase; GGT, gamma-glutamyl-transferase; AP, alkaline phosphatase.

