
Figure 4.
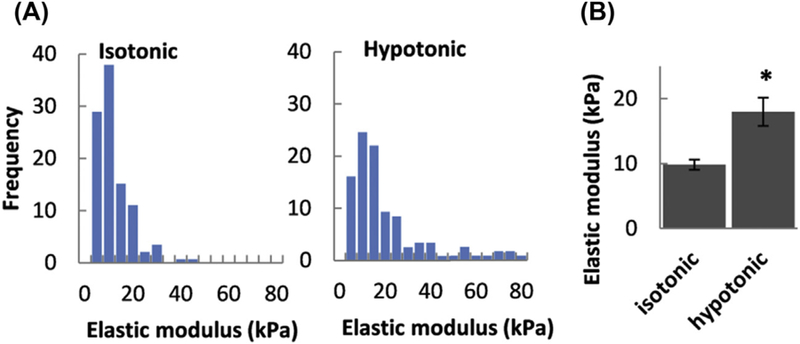
Effect of osmotic challenge on the elastic modulus of endothelial cells. (A) Histograms of elastic moduli measured in the membrane region of cells exposed to isotonic (left) and hypotonic (right) solutions. (B) Mean membrane region elastic moduli of cells in isotonic and hypotonic solutions. (Asterisk denotes significant difference using an unpaired samples T-Test (n = 15–60 cells; P < 0.05) between moduli measured under each condition).