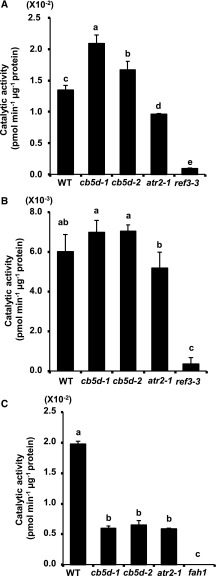
Figure 12.
Enzymatic Activity Assay of C4H and F5H in Planta.
Microsomes were prepared from 2-week-old seedlings of different genotypes, and P450 protein concentration was monitored by immunoblot analysis using anti-C4H or anti-F5H antibodies, as shown in Figure 7.
(A) and (B) C4H activity in the Col-0 wild type, cb5d-1, cb5d-2, atr2-1, and ref3-3 mutant lines in the presence of NADPH (A) or NADH (B) as the reductant.
(C) F5H activity in the Col-0 wild type, cb5d-1, cb5d-2, atr2-1, and fah1-2 mutant lines in the presence of NADPH as the reductant. No measurable activity was detected when using NADH as the reducing power.
The data represent means ± sd of three biological replicates. Three independent batches of experiments were conducted with the same results. Different letters indicate significant differences (P < 0.05; one-way ANOVA, Tukey’s HSD test) of different plant genotypes.

