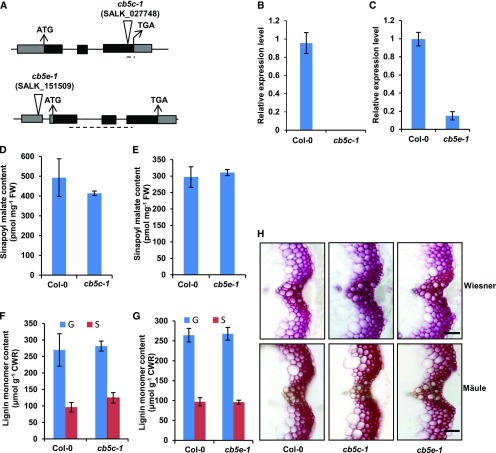
Figure 2.
Characterization of the cb5c-1 and cb5e-1 Mutants.
(A) Diagrams of the T-DNA insertion mutants of CB5C and CB5E. The triangles indicate the T-DNA insertion sites in CB5D and CB5E. The dashed lines indicate the regions used for qRT-PCR analysis of gene expression.
(B) and (C) qRT-PCR analysis of the relative expression levels of CB5C and CB5E in Col-0 wild-type and cb5c (B) or cb5e (C) seedlings. Approximately 12 2-week-old seedlings were grouped as one biological replicate for RNA extraction. qRT-PCR was performed with three biological replicates, each with four technical repeats. The data represent means ± sd of three biological replicates.
(D) and (E) Sinapoyl malate content in 2-week-old seedlings of the Col-0 wild type and cb5c-1 (D) or the Col-0 wild type and cb5e-1 (E). The data represent means ± sd of three biological repeats; each replicate is composed of 0.5 g fresh weight (FW) of pooled seedlings.
(F) and (G) Quantification of thioacidolytic lignin monomers in the cell walls of cb5c-1 (F) and cb5e-1 (G). Inflorescence stems from 12-week-old plants were used in the analysis. Stems from at least six plants were pooled as one biological replicate. The data represent means ± sd of three biological repeats. CWR, cell wall residues.
Statistical analysis of the data in (D) to (G) was conducted with two-tailed Student’s t tests. No significant differences were observed between the wild type and mutants.
(H) Histochemical observation of lignin in stem cross sections (1 cm from the bottom, 80 µm thick) of 7-week-old Col-0 wild-type, cb5c-1, and cb5e-1 plants with Wiesner staining for total lignin (top panels) and Mӓule staining for S-lignin (bottom panels). Bars = 30 µm.

