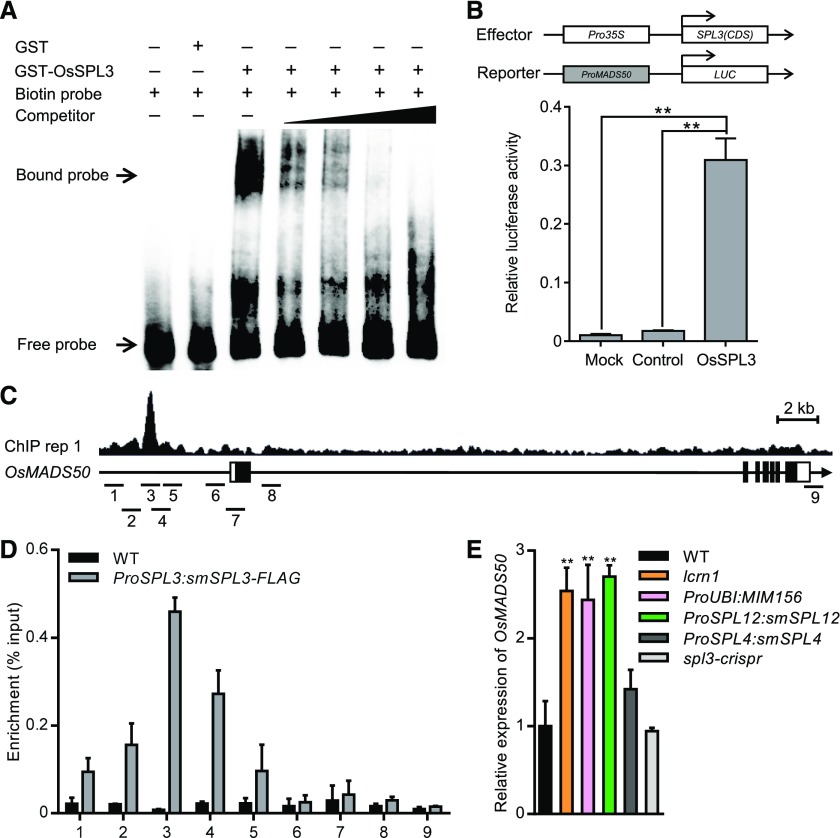
Figure 8.
OsSPL3 Positively Regulates OsMADS50 Expression.
(A) Results of an EMSA. Competition for OsSPL3 binding was performed with a cold probe (competitor) at 25 times, 50 times, 100 times, and 500 times the amount of the labeled probe (the promoter of OsMADS50, containing the GTAC motif).
(B) OsSPL3 activates the transcription of OsMADS50. Relative luciferase activity was monitored in tobacco leaves cotransfected with effector and reporter constructs. Mock, cotransfected with a reporter construct and an empty effector construct; control, cotransfected with an effector construct and an empty reporter construct. Values are means + SD (n = 3). **Significant difference (P < 0.01; Student’s t test).
(C) Representative SPL3-FLAG ChIP-seq peaks (ChIP replicate 1) at OsMADS50 revealed in Integrative Genomics Viewer. SPL3-FLAG peaks, gene structure, and the regions examined by ChIP-qPCR are shown in the top, middle, and bottom rows, respectively. The sequence regions marked 1 to 9 indicate the nine regions examined in the ChIP-qPCR assays. The black boxes represent exons and the lines between them represent introns, while the white boxes indicate untranslated regions. IGV, Integrative Genomics Viewer.
(D) Results of ChIP-qPCR assays using 5-d-old seedlings carrying the ProSPL3:smSPL3-FLAG transgene. Numbers 1 to 9 refer to the regions indicated in (C). Primers are listed in Supplemental Data Set 4. Values are means + SD (n = 3 independent pools of seedlings). WT, wild type.
(E) Transcript levels of OsMADS50 in the basal nodes of 3-d-old seedlings, as determined by quantitative real-time PCR. Data were normalized to those of the wild-type (WT) plants (the transcript level of WT was set to 1). Values are means + SD (n = 3 independent pools of basal nodes, five plants per pool). **Significant difference compared with WT (P < 0.01; Student’s t test).

