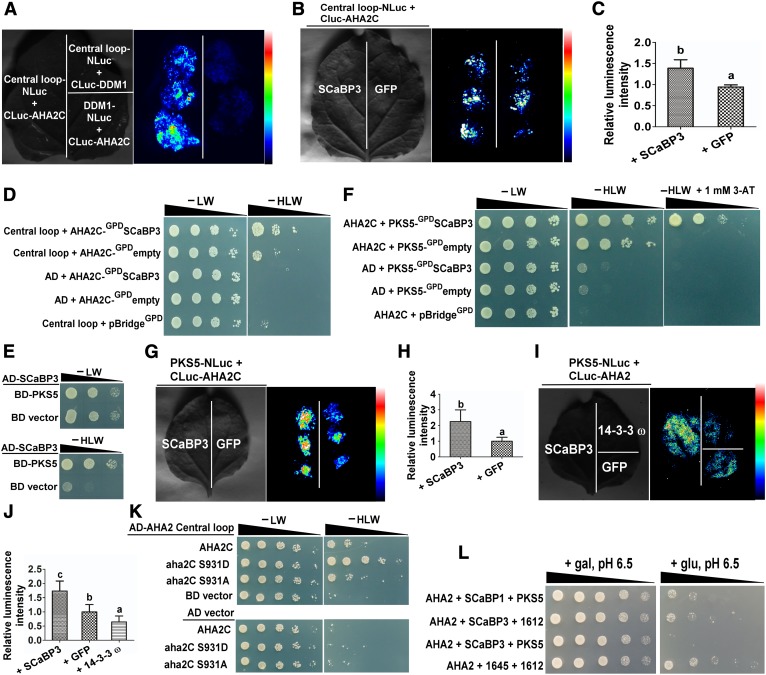
Figure 5.
SCaBP3 Promotes the Interaction between AHA2 Central Loop Region and Its C Terminus and between PKS5 and AHA2 C Terminus.
(A) LCI system analysis of the interaction between AHA2 Central loop region and C terminus. DDM1 was used as a control.
(B) LCI system analysis of AHA2 Central loop interaction with its C terminus in the presence of SCaBP3. SCaBP3 was transiently cotransformed with AHA2 Central loop and C terminus in N. benthamiana leaves. GFP was used as a control.
(C) Statistical analysis of luminescence intensity as shown in (B).
(D) Yeast three-hybrid analysis of AHA2 Central loop interaction with its C terminus in the presence or absence of SCaBP3. SCaBP3 was expressed under the control of the GPD promoter in the pBridgeGPD vector. Serial decimal dilutions of yeast cells were grown on synthetic complete medium without Leu and Trp (−LW, left panel) and on synthetic complete medium without His, Leu, and Trp (−HLW, right panel). Photographs were taken after 3 to 6 d of growth on the indicated medium.
(E) Yeast two-hybrid analysis of the interaction between SCaBP3 and PKS5.
(F) Yeast three-hybrid analysis of the interaction of PKS5 with the AHA2 C terminus in the presence or absence of SCaBP3. SCaBP3 was expressed under the control of the GPD promoter in the pBridgeGPD vector. Photographs were taken after 3 to 6 d of growth on the indicated medium. 3-AT, 3-aminotriazole.
(G) LCI system analysis of the interaction of PKS5 with the AHA2 C terminus in the presence of SCaBP3. SCaBP3 was transiently coexpressed with AHA2 and PKS5 in N. benthamiana. GFP was used as a control.
(H) Statistical analysis of luminescence intensity as shown in (G).
(I) LCI system analysis of the interaction of PKS5 with AHA2 in the presence of SCaBP3. SCaBP3 was transiently cotransformed with AHA2 and PKS5 in N. benthamiana. 14-3-3 ω and GFP were used as controls.
(J) Statistical analysis of luminescence intensity as shown in (I).
(K) Yeast two-hybrid analysis the effect of different phosphorylation levels on the interaction with its Central loop. Photographs were taken after 3 to 5 d of growth on the indicated medium.
(L) Analysis of SCaBP3-PKS5 inhibition of PM H+-ATPase activity in yeast. Cells were quintuple diluted in sterile water and grown on selective medium, pH 6.5. AHA2, pMP1745-AHA2; gal, galactose; glu, glucose; PKS5, pMP1612-PKS5; SCaBP1, pMP1645-SCaBP1; SCaBP3, pMP1645-SCaBP3; 1612, pMP1612; 1645, pMP1645. The growth of the cells was detected 3 to 5 d after transformation.
The experiments were performed with three biological replicates with similar results. Data represent means ± sd (n = 6) from measurements using the same preparation as in (C), (H), and (J). Lowercase letters indicate significant differences from GFP treatment as determined by Student’s t test, P < 0.05.

