Figure 6.
Relief of SCaBP3-Regulated Inhibition of AHA2 under Alkaline Conditions.
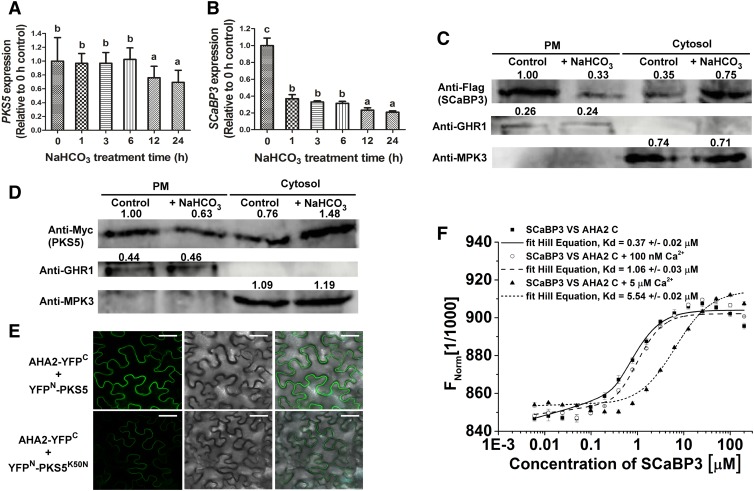
(A) and (B) RT-qPCR assay for detection of PKS5 (A) and SCaBP3 (B) expression after NaHCO3 treatment. Total RNA was extracted from 7-d-old seedlings treated with 1.5 mM NaHCO3 for 0, 1, 3, 6, 12, or 24 h. The samples were treated with RNase-free DNase and then used to produce cDNAs. Then the cDNAs were used for detecting PKS5 (the primer pairs are PKS5 qRT-F and PKS5 qRT-R, and their sequences are listed in the Supplemental Table) and SCaBP3 (the primer pairs are SCaBP3 qRT-F and SCaBP3 qRT-R, and their sequences are listed in the Supplemental Table) expression using RT-qPCR assay. ACTIN2 (the primer pairs are ACTIN2-qF and ACTIN2-qR, and their sequences are listed in the Supplemental Table) served as an internal control.
(C) and (D) SCABP3 (C) and PKS5 (D) were detected in plasma membrane (PM) and cytosol with or without NaHCO3 treatment. Plasma membrane and cytosol were isolated from 7-d-old seedlings of Col-0 expressing 35SPro::3×Flag-SCABP3 or 35SPro::6×Myc-PKS5 treated with 1.5 mM NaHCO3 for 0 or 24 h. Isolation of plasma membrane was by two-phase partitioning. Equal amounts of plasma membrane and cytosolic proteins were separated by SDS-PAGE followed by analysis with anti-Flag, anti-Myc, anti-GHR1 (a plasma membrane-localized protein), or anti-MPK3 (a cytosol-localized protein) antibodies.
(E) Analysis of the interaction between AHA2 and PKS5/PKS5K50N (a dead kinase with no kinase activity) in N. benthamiana. Pairs of split-YFP constructs were transiently coexpressed in N. benthamiana leaves, and YFP fluorescence signal was detected using Leica SP5 confocal microscopy after 48 h of infiltration. Bars = 50 μm.
(F) Analysis of concentrations of Ca2+ on the interaction between SCaBP3 and the AHA2 C terminus using MST. Unlabeled GST-SCaBP3 recombinant protein was titrated to a constant amount of fluorescently NT647-labeled HIS-AHA2 C terminus recombinant peptide in the presence of 0, 100 nM, or 5 μM Ca2+. Kd, dissociation constant.
The experiments were performed with three biological replicates with similar results. Data represent means ± sd (n = 3) from measurements using the same preparation as in (A), (B), and (F). Lowercase letters indicate significant differences from the control as determined by one-way ANOVA, P < 0.05.

