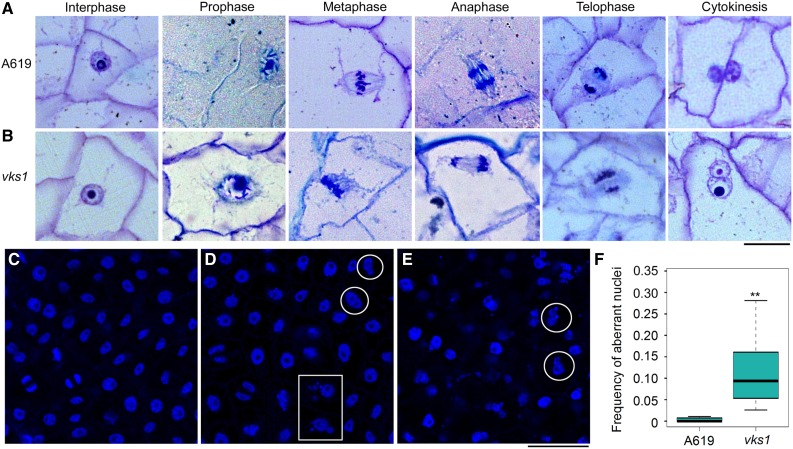
Figure 7.
The Phenotypes of Endosperm Cells and Nuclei in A619 and vks1 during Early Development.
(A) and (B) Endosperm cells undergoing mitosis and cytokinesis in A619 (A) and vks1 (B) at 6 DAP. Bar = 25 μm.
(C) to (E) Nuclei of endosperm cells during mitosis in A619 (C) and vks1 ([D] and [E]) at 6 DAP. (D) shows a mild phenotype and (E) shows a severe phenotype of vks1. The nuclei stained by DAPI are in blue. Bar = 50 μm.
(F) Frequency of aberrant nuclei in endosperms of A619 and vks1 at 6 DAP. More than 4000 nuclei of A619 and 2600 nuclei of vks1 from 20 microscope fields were observed. The mean value of the ratios of aberrant nuclei to total nuclei in each field of A619 or vks1 was used to represent the frequency of aberrant nuclei in endosperm. **, P < 0.01 as determined by Student’s t test.

