Figure 1.
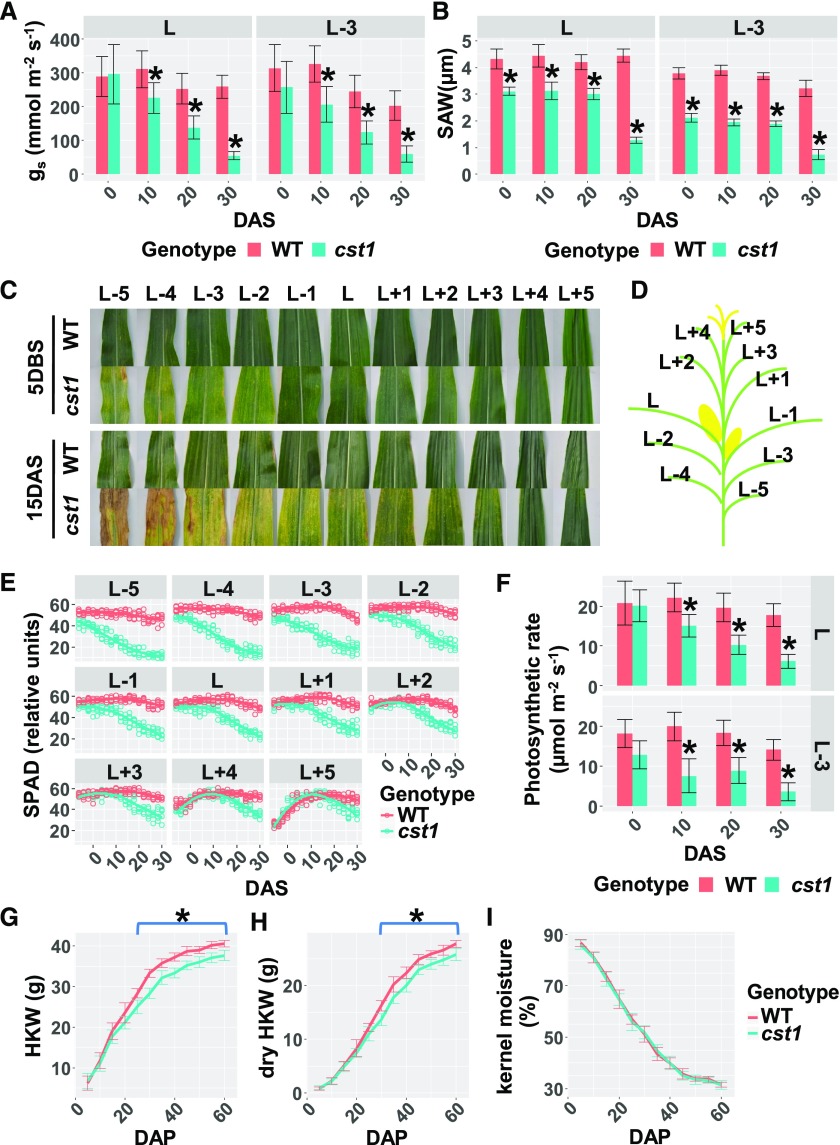
The cst1 Plants Exhibit Diminished Stomatal Conductance, Reduced Source Capacity, and Lower Yield Compared With the Wild-Type (WT) Plants.
(A) and (B) The stomatal conductance (gs; A) and SAW (B) of wild-type and cst1 leaves (L and L-3) at 0, 10, 20, and 30 DAS. Leaves are labeled as shown in (D). Data are means ±sd of 10 plants for each genotype. (C) Wild-type and cst1 leaves 5 DBS and 15 DAS. Leaves are labeled as shown in (D).
(E) Total chlorophyll contents (represented as SPAD values) in wild-type and cst1 leaves from 6 DBS to 30 DAS. Five plants of each genotype were measured every 2 d. Measurements were fitted by LOESS (Local Regression) curves.
(F) Photosynthetic rates of wild-type and cst1 leaves (L and L-3) at 0, 10, 20, and 30 DAS. Shown are means ±sd (n = 10).
(G) to (I) HKW (G), dry HKW (H), and kernel moisture (I) were measured in wild-type and cst1 kernels from 5 DAP to 60 DAP. For each genotype, 9 ears (from 9 different plants) were sampled every 5 d, with 10 kernels randomly sampled from each ear. Measurements were fitted with LOESS (Local Regression) curves. Shown are means ±sd (n = 9). In (A), (B), (F), (G), and (H), asterisks indicate significant difference from wild type (p.adj < 0.05) by the Tukey's honestly significant difference test (Supplemental Data Set 1).

