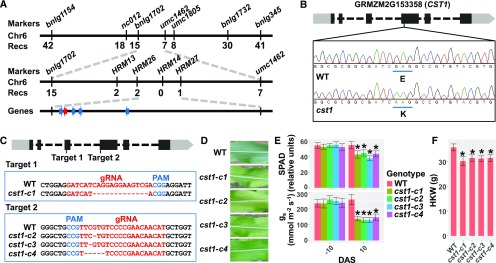
Figure 2.
Map-Based Cloning of cst1.
(A) Map-based cloning of cst1. Molecular markers and number of recombinants are indicated above and below the filled bars, respectively. The candidate gene (GRMZM2G153358) is indicated by a red arrow, whereas the other genes within this genomic interval are indicated by blue arrows. Chr, chromosome; Recs, recombinations.
(B) A schematic representation of the genomic structure of GRMZM2G153358. The light and dark gray filled boxes indicate untranslated region (UTR)s and coding exons, respectively. The dashed lines indicate introns. The codons that overlap with the base substitution are underlined in wild type (WT) and cst1, with corresponding amino acids labeled below the codons.
(C) The two target sites (designated Target 1 and Target 2) used for gene targeting are shown at top. At middle (for Target 1) and bottom (for Target 2) are shown the wild type and mutated sequences. gRNA, guide RNA; PAM, protospacer adjacent motif.
(D) Ear leaves of wild type, cst1-c1, cst1-c2, cst1-c3, and cst1-c4 at 5 DAS.
(E) Total chlorophyll content (SPAD) and stomatal conductance (gs) of wild type and cst1-c1, cst1-c2, cst1-c3, and cst1-c4 ear leaves at −10 and 10 DAS. Shown are mean ±sd of 10 leaves for each genotype.
(F) HKW of wild type, cst1-c1, cst1-c2, cst1-c3, and cst1-c4 at 60 DAP, when grain-filling is complete. Shown are means ±sd of 10 ears for each genotype. In (E) and (F), asterisks indicate significant difference from wild type (P < 0.05) by the Student’s t test (Supplemental Data Set 1).

