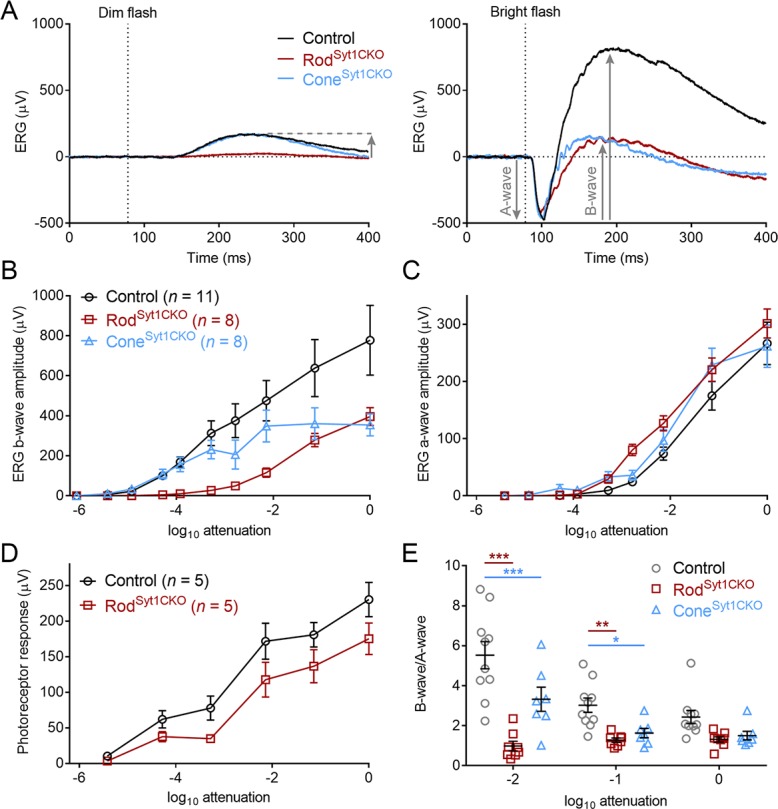
Figure 2. Flash ERG responses suggest a significant role for Syt1 in photoreceptor neurotransmission.

(A) Example ERG recordings from control, RodSyt1CKO, and ConeSyt1CKO retinas in response to 20 ms dim (left, 10−4 of maximum) and bright (right, 10−1 of maximum) flashes. Downward gray arrows indicate a-waves and upward arrows indicate b-waves (a-waves are obscured by b-waves at low intensities). (B) Average b-wave flash intensity-response functions for the three genotypes. Maximum intensity b-waves: control: 777.7 ± 174.4 μV, RodSyt1CKO: 396.1 ± 44.3 μV, ConeSyt1CKO: 354.0 ± 55.5 μV; RodSyt1CKO vs. control: p=0.10, ConeSyt1CKO vs. control: p=0.06 (one-way ANOVA). (C) A-wave flash intensity-response curves for the three genotypes. Same legend as B). Maximum intensity a-waves: control: 266.7 ± 37.1 μV, RodSyt1CKO: 301.4 ± 25.4 μV, ConeSyt1CKO: 261.6 ± 37.0 μV; RodSyt1CKO vs. control: p=0.72, ConeSyt1CKO vs. control: p=0.99 (one-way ANOVA). (D) Isolated photoreceptor responses in control and RodSyt1CKO retinas. No means were significantly different (t-tests corrected for multiple comparisons). (E) B-wave/a-wave ratios for control (n = 10), RodSyt1CKO (n = 8), and ConeSyt1CKO (n = 7) retinas. 10−2 attenuation: control: 5.5 ± 0.68, RodSyt1CKO: 0.99 ± 0.24, ConeSyt1CKO: 3.3 ± 0.61; RodSyt1CKO vs. control: p=0.0001, ConeSyt1CKO vs. control: p=0.0005. 10−1 attenuation: control: 3.0 ± 0.36, RodSyt1CKO: 1.3 ± 0.11, ConeSyt1CKO: 1.6 ± 0.23; RodSyt1CKO vs. control: p=0.004, ConeSyt1CKO vs. control: p=0.03. Maximum intensity: control: 2.4 ± 0.33, RodSyt1CKO: 1.3 ± 0.13, ConeSyt1CKO: 1.5 ± 0.22; RodSyt1CKO vs. control: p=0.08, ConeSyt1CKO vs. control: p=0.19 (repeated measures 2-way ANOVA). ***p≤0.0005, **p=0.004, *p=0.03.
