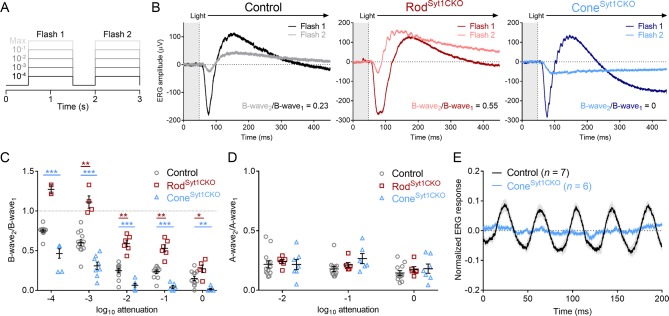
Figure 3. Double-flash and flicker ERG responses indicate severely impaired neurotransmission in photoreceptors that lack Syt1.
(A) Schematic of the double-flash ERG protocol used for data in B-D. (B) Examples of superimposed ERG responses to the first and second flashes elicited by the protocol in A (10−1 of maximum intensity) from control, RodSyt1CKO, and ConeSyt1CKO retinas. (C) B-wave2/B-wave1 ratios for the three genotypes across flash intensities. 10−4 attenuation: control: 0.75 ± 0.02, n = 12; RodSyt1CKO: 1.27 ± 0.06, n = 2; ConeSyt1CKO: 0.46 ± 0.06, n = 7; RodSyt1CKO vs. control not analyzed because n = 2, ConeSyt1CKO vs. control: p=0.0005. 10−3 attenuation: control: 0.60 ± 0.04, n = 13; RodSyt1CKO: 1.11 ± 0.08, n = 4; ConeSyt1CKO: 0.31 ± 0.05, n = 8; RodSyt1CKO vs. control: p=0.0005, ConeSyt1CKO vs. control: p=0.0008. 10−2 attenuation: control: 0.25 ± 0.02, n = 13; RodSyt1CKO: 0.59 ± 0.04, n = 6; ConeSyt1CKO: 0.064 ± 0.02, n = 7; RodSyt1CKO vs. control: p=0.0005, ConeSyt1CKO vs. control: p=0.0008. 10−1 attenuation: control: 0.24 ± 0.02, n = 12; RodSyt1CKO: 0.53 ± 0.04, n = 6; ConeSyt1CKO: 0.042 ± 0.02, n = 6; RodSyt1CKO vs. control: p=0.0005, ConeSyt1CKO vs. control: p=0.0008. Maximum intensity: control: 0.15 ± 0.03, n = 12; RodSyt1CKO: 0.27 ± 0.05, n = 5; ConeSyt1CKO: 0.014 ± 0.01, n = 7; RodSyt1CKO vs. control: p=0.02, ConeSyt1CKO vs. control: p=0.005 (one-way ANOVAs corrected for multiple comparisons). (D) A-wave2/A-wave1 ratios for the three genotypes. No comparisons with control were significant at any intensity. 10−2 attenuation: control: 0.22 ± 0.03, n = 13; RodSyt1CKO: 0.24 ± 0.02, n = 6; ConeSyt1CKO: 0.22 ± 0.04, n = 7; RodSyt1CKO vs. control: p=0.93, ConeSyt1CKO vs. control: p=0.99. 10−1 attenuation: control: 0.18 ± 0.02, n = 12; RodSyt1CKO: 0.21 ± 0.02, n = 6; ConeSyt1CKO: 0.27 ± 0.04, n = 6; RodSyt1CKO vs. control: p=0.93, ConeSyt1CKO vs. control: p=0.17. Maximum intensity: control: 0.14 ± 0.02, n = 12; RodSyt1CKO: 0.18 ± 0.02, n = 6; ConeSyt1CKO: 0.18 ± 0.04, n = 7; RodSyt1CKO vs. control: p=0.93, ConeSyt1CKO vs. control: p=0.76 (one-way ANOVAs corrected for multiple comparisons). (E) Average (± SEM) normalized ERG responses of control and ConeSyt1CKO retinas to a bright 25 Hz flicker stimulus. ***p<0.001, **p=0.005, *p=0.02.

