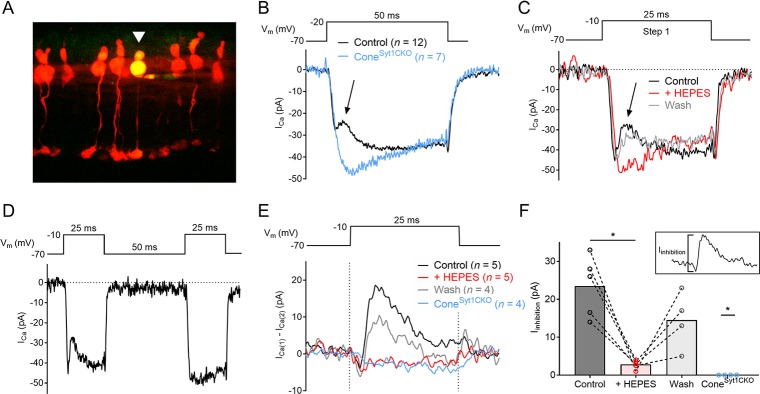
Figure 4. Cones lacking Syt1 do not experience inhibition of ICa by vesicular H+.
(A) Image of tdTomato+ cones in an ex vivo retinal slice. One cone was filled with a patch pipette solution supplemented with Lucifer yellow (arrowhead). (B) Average ICa recorded from 12 control and 7 Syt1-deficient cones evoked by a depolarizing step. The arrow points to transient ICa inhibition in control cones. (C) ICa traces from a control cone in response to a depolarizing step in control conditions, in the presence of 20 mM HEPES, and after washout of HEPES. (D) The paired-pulse protocol used to isolate Iinhibition in E–F) and an example of ICa recorded from a control cone (same cell as shown in C). (E) Average Iinhibition obtained by subtracting ICa during the second step (ICa(2)) from the first step (ICa(1)) of the paired-pulse protocol (subtraction traces were smoothed for clarity). Dashed lines indicate the duration of the depolarizing step. (F) Peak amplitude of Iinhibition from control cones in control conditions, control cones with 20 mM HEPES, control cones after washout, and ConeSyt1CKO cones in control conditions. Inset image shows Iinhibition amplitude measurement for the control condition. Control: 23.5 ± 3.6, n = 5; HEPES: 2.8 ± 0.5, n = 5; washout: 14.5 ± 3.8, n = 4; ConeSyt1CKO: 0, n = 4. Control vs. HEPES: p=0.04, control vs. wash: p=0.07 (repeated measures one-way ANOVA); control vs. ConeSyt1CKO: p=0.02 (Mann-Whitney test). One cone was lost before washout so it could not be included in ANOVA analysis. *p≤0.04.

