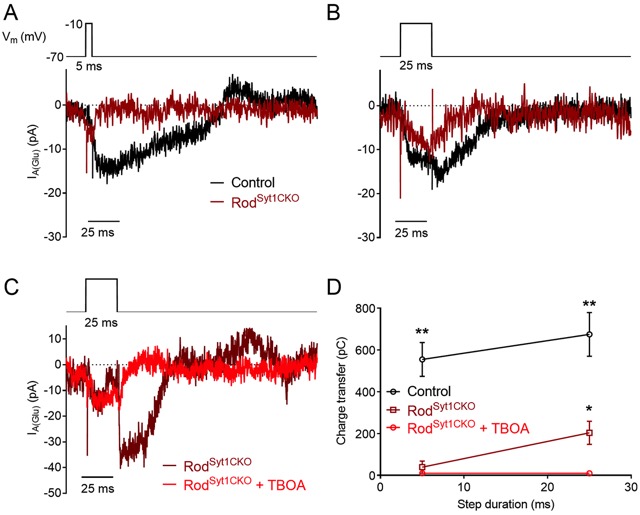
Figure 6. Glutamate release is diminished in rods lacking Syt1.

Example IA(Glu) recordings from control and Syt1-deficient rods in response to 5 (A) and 25 (B) ms depolarizing steps (−70 to −10 mV). (C) Example IA(Glu) recordings from a Syt1-deficient rod evoked by 25 ms steps in control conditions and following bath application of the glutamate transport inhibitor, TBOA (300 μM). (D) IA(Glu) charge transfer as a function of step duration in control rods, RodSyt1CKO rods, and in RodSyt1CKO rods in the presence of 300 μM TBOA. 5 ms: control: 555 ± 81 pC, n = 39 rods; RodSyt1CKO: 39.1 ± 29,3 pC, n = 31 rods; RodSyt1CKO + TBOA: 10.0 ± 2.9 pC, n = 6 rods; RodSyt1CKO vs. control: p<0.0001. 25 ms: control: 674 ± 105 pC, n = 37 rods; RodSyt1CKO: 203.7 ± 55.7 pC, n = 44 rods; RodSyt1CKO + TBOA: 9.6 ± 7.5 pC, n = 8 rods; RodSyt1CKO vs. control: p<0.0001 (t-tests corrected for multiple comparisons), RodSyt1CKO vs. RodSyt1CKO + TBOA: p=0.0012 (Welch’s t-test). **p<0.0001, *p=0.0012.
