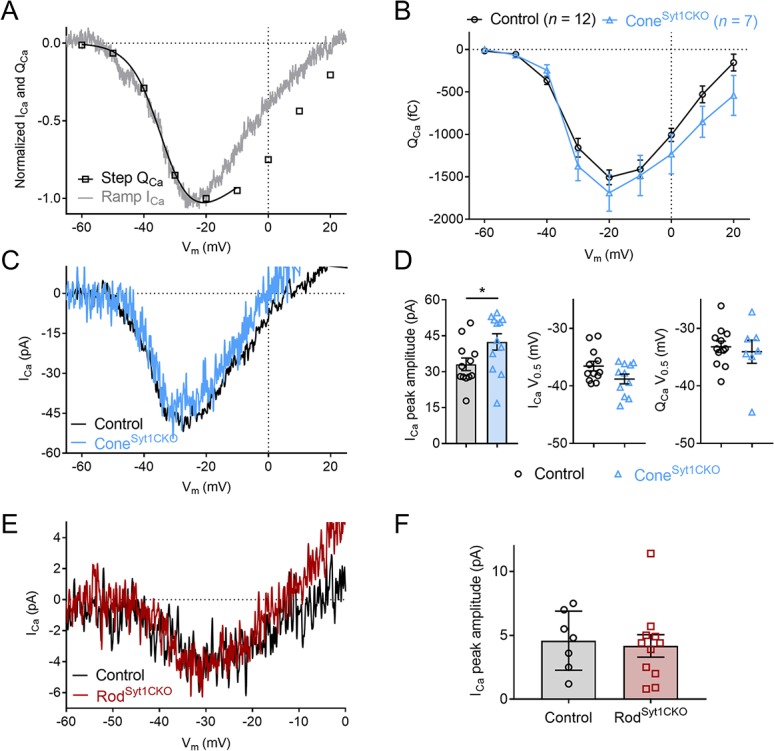
Figure 8. ICa is not reduced in photoreceptors lacking Syt1.

(A) Example current-voltage relationship of ramp-evoked ICa and step-evoked QCa (a Boltzmann function adjusted for Ca2+ driving force was fit to QCa) in a control cone. (B) Average QCa as a function of step voltage for control and ConeSyt1CKO cones. No means differed significantly (t-tests corrected for multiple comparisons). (C) Example ramp-evoked ICa traces from a control and ConeSyt1CKO cone. (D) Ramp-evoked ICa peak amplitude (left) and V0.5 values (middle), and step-evoked QCa V0.5 values (right) from control and ConeSyt1CKO cones. ICa amplitude: Control: 33.1 ± 2.63 pA, n = 12; ConeSyt1CKO: 42.5 ± 3.43 pA, n = 12; p=0.04 (t-test). ICa V0.5: Control: −36.6 ± 0.83 mV, n = 12; ConeSyt1CKO: −38.8 ± 0.84 mV, n = 11; p=0.07 (t-test). QCa V0.5: Control: −33.2 ± 0.98 mV, n = 12; ConeSyt1CKO: −34.1 ± 2.01 mV, n = 7; p=0.67 (t-test). (E) Average ICa traces from control and RodSyt1CKO rods. (F) Ramp-evoked ICa peak amplitude from control and RodSyt1CKO rods. Control: 4.6 ± 0.87 pA, n = 7; RodSyt1CKO: 4.2 ± 0.88 pA, n = 11; p=0.76 (t-test).
