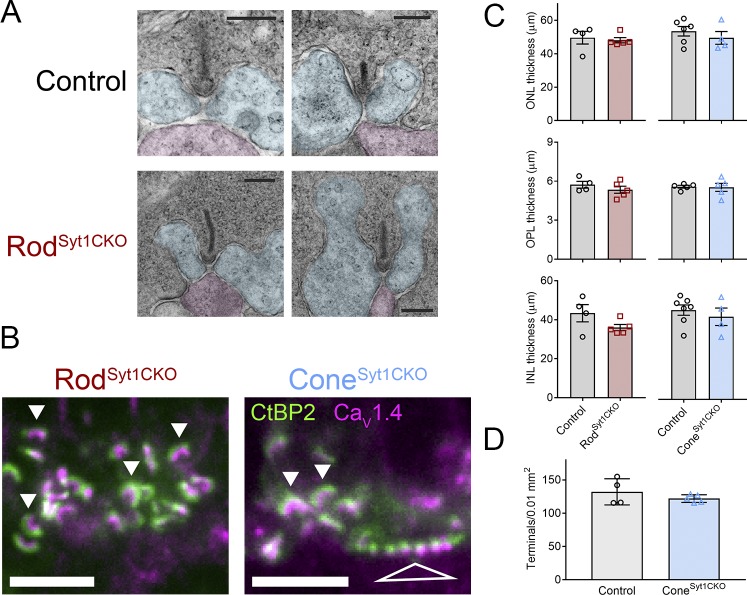
Figure 9. Photoreceptor synapses and retinal lamination appear unchanged in Syt1-mutant retinas.
(A) TEM images of two rod synapses each from a control and RodSyt1CKO retina with pseudocoloring of presumed horizontal cell (blue) and rod bipolar cell (magenta) dendrites. Scale bars = 200 nm. (B) Images centered on the OPL of RodSyt1CKO and ConeSyt1CKO retinas co-labeled with antibodies to CaV1.4 (magenta) and CtBP2 (ribbons, green). Solid arrowheads indicate exemplar rod ribbon complexes and the open triangle points to numerous ribbon complexes within a cone terminal. Scale bars = 5 µm. (C) Measurements of ONL, OPL, and INL thickness from RodSyt1CKO, ConeSyt1CKO, and their respective control retinas. ONL: rod control: 49.6 ± 3.79 μm, n = 4; RodSyt1CKO: 48.1 ± 1.56 μm, n = 5; p=0.69; cone control: 53.5 ± 2.88 μm, n = 6; ConeSyt1CKO: 49.5 ± 3.84 μm, n = 4; p=0.42. OPL: rod control: 5.7 ± 0.26 μm, n = 4; RodSyt1CKO: 5.3 ± 0.27 μm, n = 5; p=0.34; cone control: 5.6 ± 0.10 μm, n = 5; ConeSyt1CKO: 5.5 ± 0.31 μm, n = 5; p=0.88. INL: rod control: 43.4 ± 4.42 μm, n = 4; RodSyt1CKO: 36.0 ± 1.58 μm, n = 5; p=0.13; cone control: 45.8 ± 2.64 μm, n = 7; ConeSyt1CKO: 42.4 ± 4.49 μm, n = 4; p=0.50 (t-tests). (D) Density of cone terminals per 0.01 mm2 in control and ConeSyt1CKO retinas. Control: 132.2 ± 9.81, n = 4 retinas; ConeSyt1CKO: 122.1 ± 2.59, n = 5 retinas; p=0.30 (t-test).

