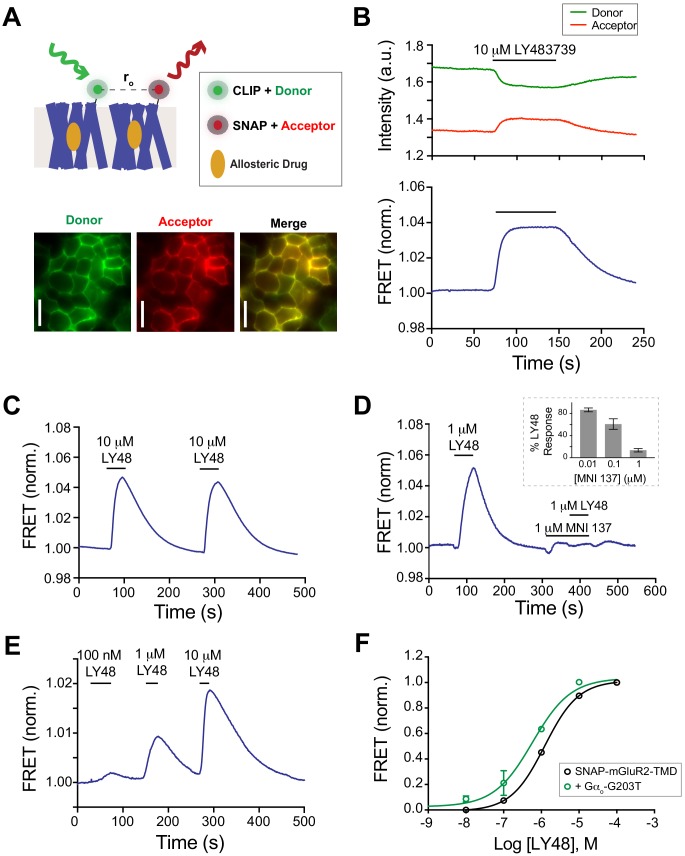
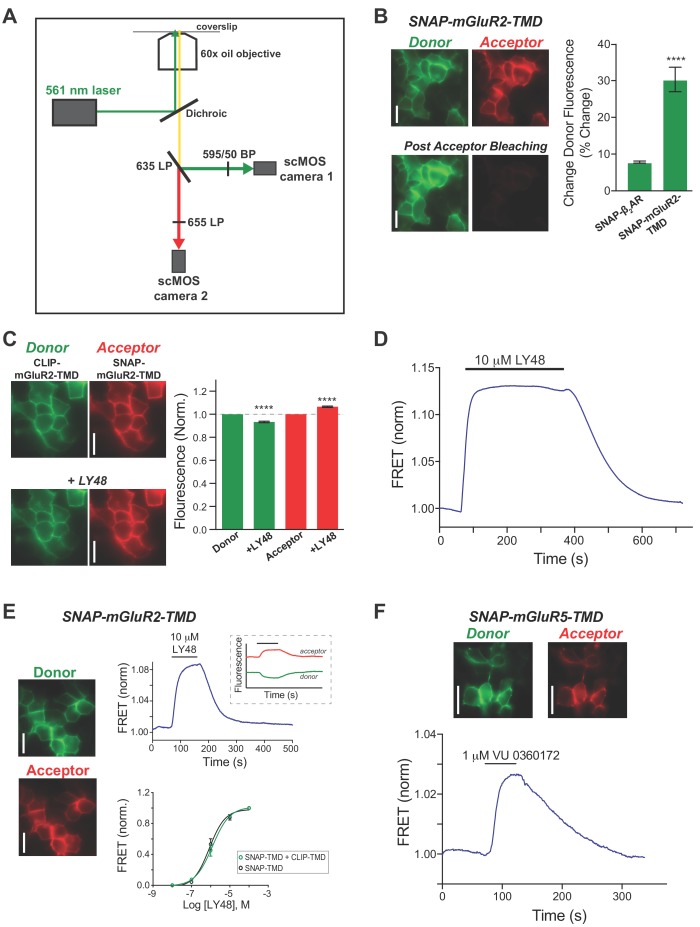
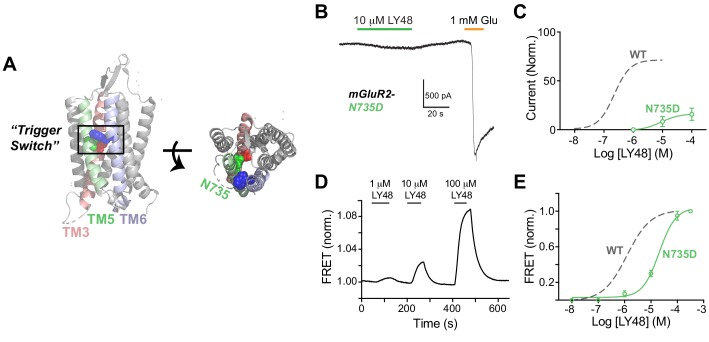
Figure 3. An inter-TMD FRET assay reveals LBD-independent reorientation in response to positive allosteric modulators.
(A) Top, schematic showing SNAP- and CLIP-tagged mGluR2-TMD constructs labeled with donor and acceptor fluorophores. Bottom, images showing donor and acceptor channels following donor excitation with a 561 nm laser. Scale bars = 40 μm. (B) Representative time course showing donor and acceptor fluorescence intensity (top) during LY48 application. Baseline-normalized FRET is shown in the bottom trace, revealing a large, reversible increase in response to LY48 application. (C–E) Representative traces showing that LY48-induced inter-TMD FRET increase is repeatable (C), blocked by the NAM MNI 137 (D), and dose-dependent (E). The inset to (D) shows the extent of block of a 10 μM LY48 response by different concentrations of MNI 137. (F) Dose–response curve for LY48-induced FRET increase for SNAP-mGluR2-TMD (EC50 = 1.2 ± 0.1 µM), WT-SNAP-mGluR2 + dominant negative G protein (EC50 = 0.6 ± 0.04 µM). The dose–response curves were significantly different (two-way ANOVA, p=0.002). Values are normalized to saturating LY48 and come from at least three separate experiments per conditions. Error bars show s.e.m.


