. 2019 Jun 7;8:e45116. doi: 10.7554/eLife.45116

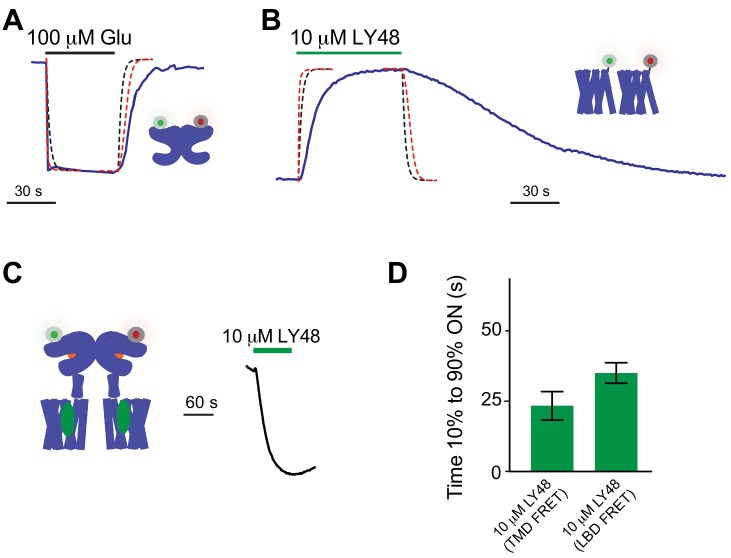
Figure 5. Comparative analysis of kinetics of glutamate-induced LBD FRET changes and LY48-induced TMD FRET changes.

(A) Representative inter-LBD (top) and inter-TMD (bottom) FRET traces showing the timing of responses to saturating glutamate and LY48, respectively. (B) Summary graph showing the dose-dependence of the ON kinetics of ligand-induced inter-TMD or inter-LBD FRET changes. * indicates statistical significance between glutamate and LY48 responses at a given concentration (unpaired t tests: for 1 µM, p=0.02; for 10 µM, p=0.04; for 100 µM, p=0.03). (C) Summary graph showing the dose-dependence of the OFF kinetics of ligand-induced inter-TMD or inter-LBD FRET changes. * indicates statistical significance between glutamate and LY48 responses at a given concentration (unpaired t tests: for 1 µM p=0.0003; for 10 µM, p=0.0007 µM; for 100 µM p=0.001). Error bars show s.e.m. Values come from at least three separate measurements per conditions.

Figure 5.

Figure 5—figure supplement 1. Further analysis of glutamate-induced inter-LBD kinetics and LY48-induced inter-TMD kinetics.

Figure 5—figure supplement 1.

(A–B) Calculated traces using a model with simple ligand binding and un-binding to an accessible site showing the expected time course of changes in the bath concentration of drug (black dotted line) and the expected response for a concentration ten times the EC50 (red dotted line; values calculated using a Hill equation with n = 1) for the experimental system (25 mL/minute flow with a 0.5 mL chamber and uniform mixing) compared to raw data (blue line) for glutamate-induced LBD FRET changes (A) or LY48-induced TMD FRET changes (B). (C) Representative trace showing the inter-LBD FRET response to LY48 in the presence of 10 µM DCG-IV. (D) Summary bar graph showing similar ON kinetics of LY48 response in both inter-TMD and inter-LBD FRET assays.