
Fig. 5. Robustness of the jumping protocol.
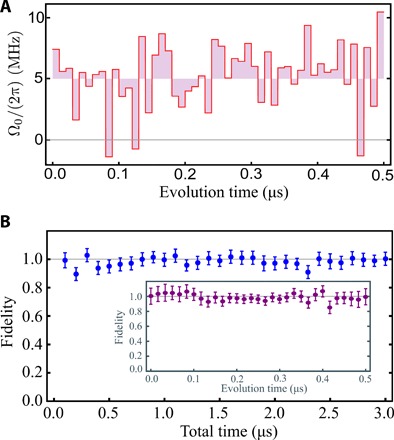
(A) Exemplary time trace of the driving Rabi frequency. The amplitudes of the Rabi frequency are randomly generated by the Gaussian distribution with a mean of 2π × 5 MHz and an SD of 2π × 2.5 MHz. The amplitudes are uncorrelated at every slices of duration of 10 ns. (B) Fidelity to the final adiabatic state as a function of the total time using the amplitudes as in (A) and the initial state prepared in the eigenstate ∣x〉. The inset of (B) shows the fidelity during the evolution time t for N = 5. The fidelity is measured by comparing the experimental state with the ideal state under an infinitely slow adiabatic evolution.