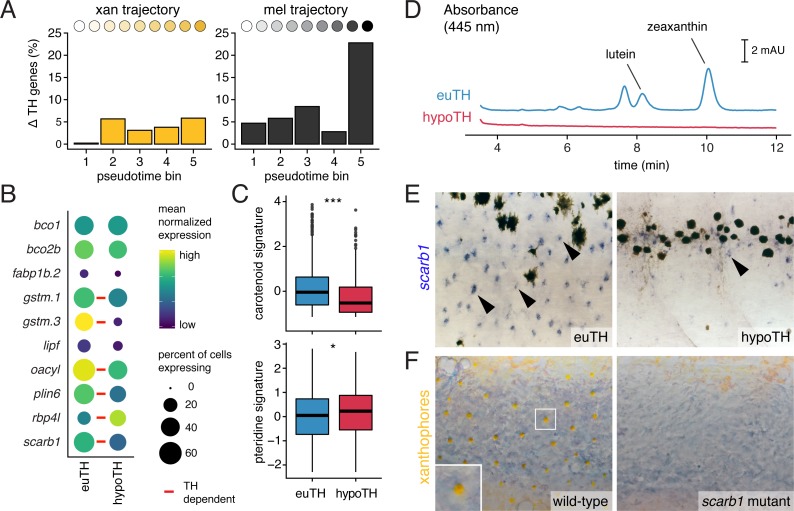
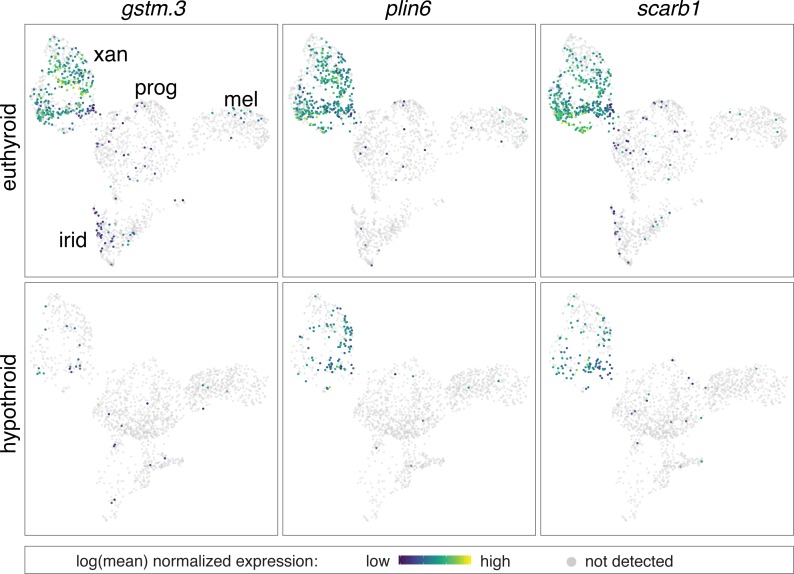
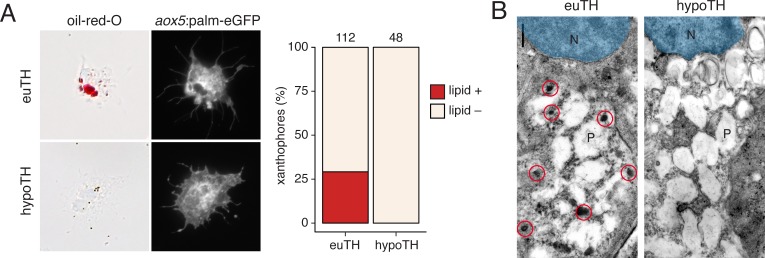
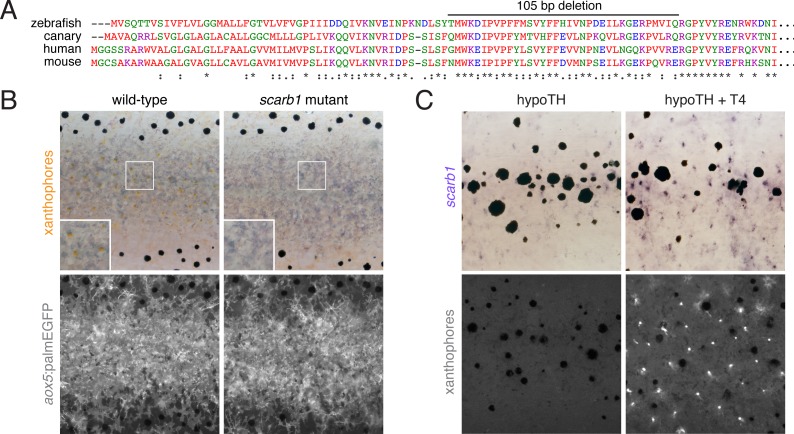
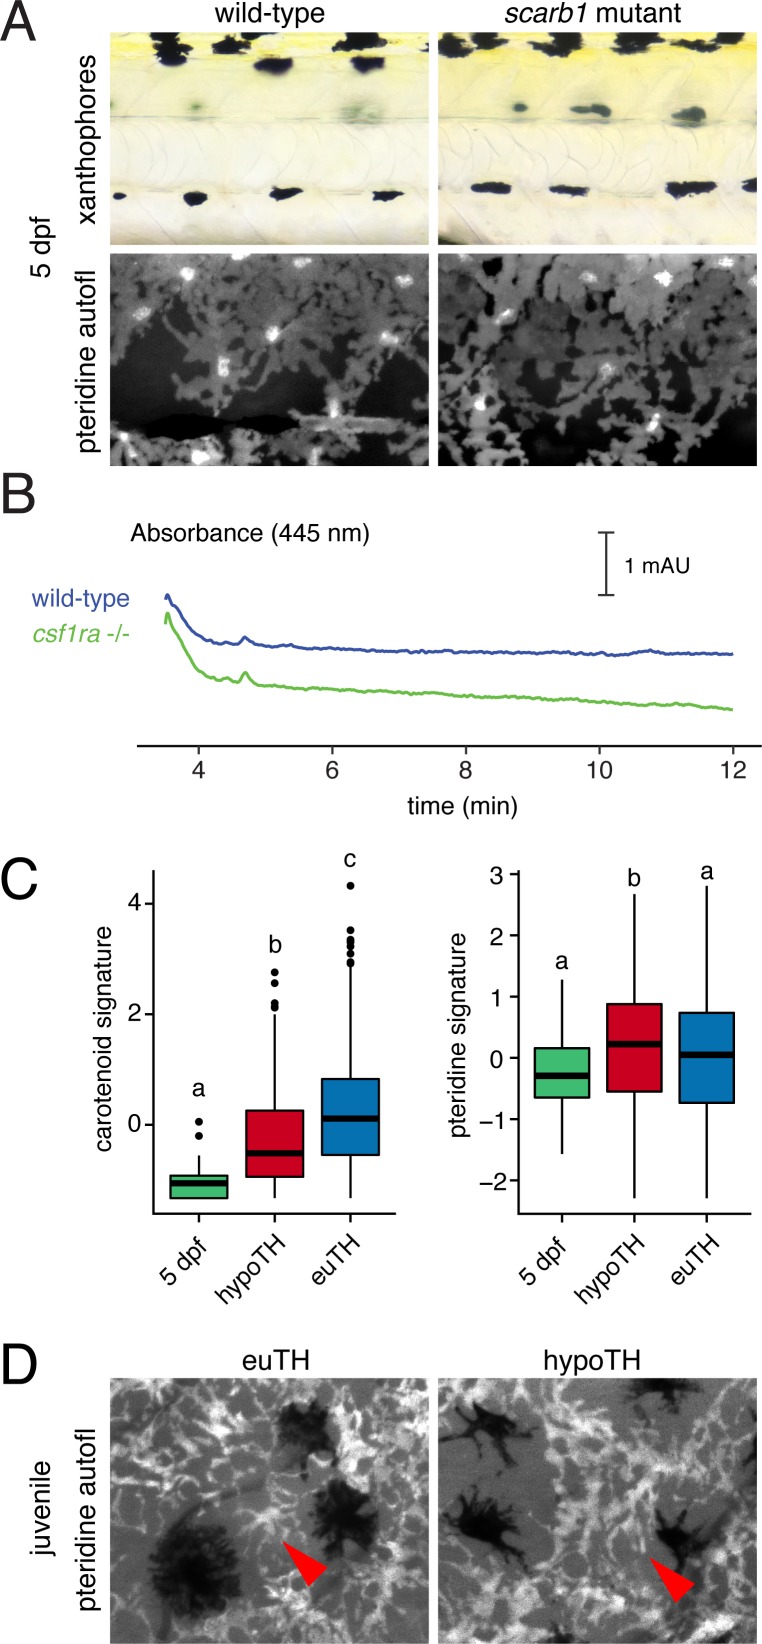
Figure 6. TH promotes xanthophore maturation via scarb1-dependent carotenoid uptake.
(A) Proportions of differentially expressed genes in euthyroid and hypothyroid cells across pseudotime bins. Xanthophores expressed fewer TH-dependent genes than melanophores (expressed gene cutoff = 2% of bin expressing, DEGs are genes with q < 0.05 and fold change >1.5X). Of 160 xanthophore DEGs and 519 melanophore DEGs, only 58 were found to be overlapping. (B) TH-dependent expression of genes related to carotenoid pigmentation in xanthophores. Red bars: q < 0.05, log2 fold-change ≥2.0. (C) Carotenoid pathway gene expression score was higher in xanthophore lineage cells of euthyroid fish compared to hypothyroid fish (p=1.5E-15, Wilcoxon). By contrast, pteridine pathway gene expression was marginally lower in cells from euthyroid fish (p=0.01). Box-and-whisker plots represent scores across groups (center line, median; box limits, upper and lower quartiles; whiskers, 1.5x interquartile range; points, outliers). (D) Carotenoids were detected by HPLC in skin containing xanthophores of euthyroid but not hypothyroid fish (11 SSL). (E) scarb1 expression in euthyroid and hypothyroid zebrafish (10 SSL). (F) scarb1 mutants lacked mature, yellow xanthophores (12 SSL).

