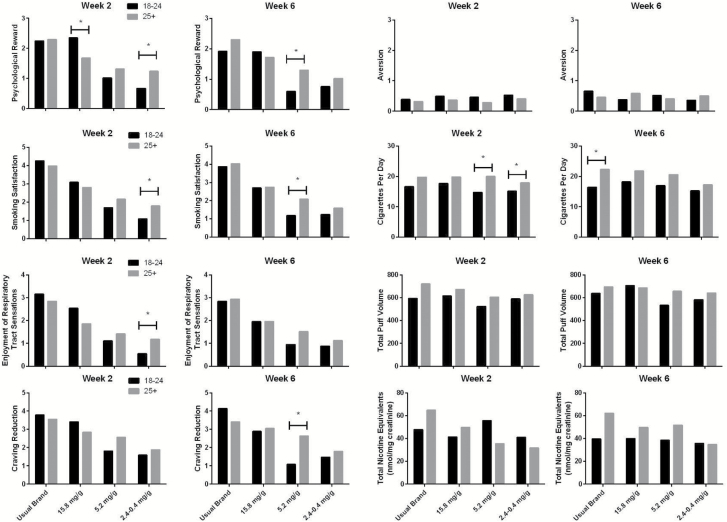
Figure 1.
The figure presents the mean predicted values data from all outcome variables listed in Table 1. Asterisks represent a significant mean difference. Note that TNEs are presented as geometric means in their raw units, though these were log transformed prior to analysis.

