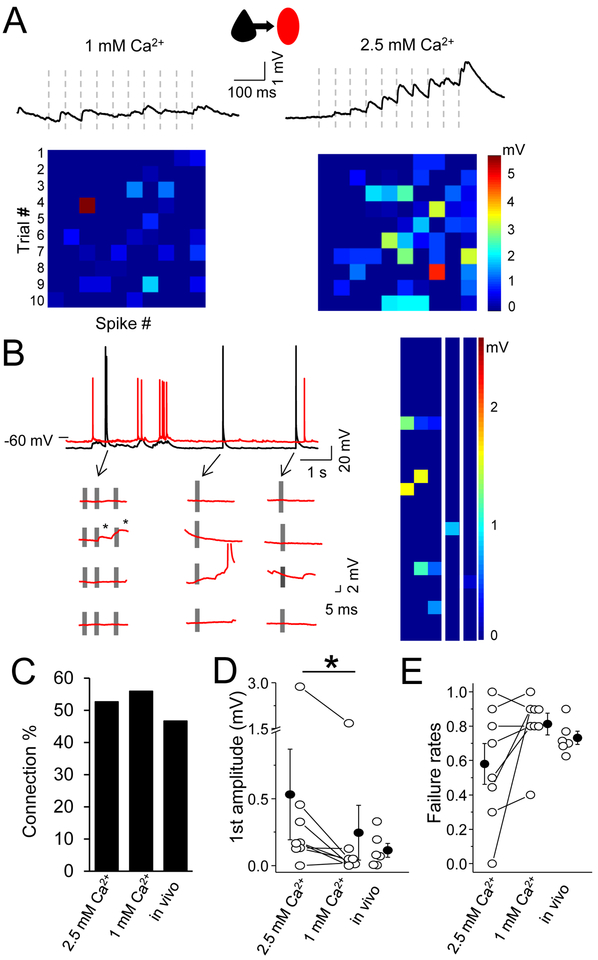
Figure 1. Local excitatory synaptic transmission onto layer 2/3 SST neurons is suppressed by network activity.
(A) The averaged trace of 10 response trials for a synaptic connection from a L2/3 pyramidal neuron to an SST interneuron (Pyr-SST) under normal (right) and elevated Ca2+ recording conditions. Ten presynaptic spikes (dashed vertical lines) at 20 Hz were delivered. Heatmaps at bottom show response amplitude for 10 trials (columns) with 10 spike pulses each (rows), using a linear scale where red scaled to the maximum amplitude. (B) Individual SST (red) response to a naturalistic spike train in pyramidal neuron (black), below 4 subsequent examples at higher time scale. Gray bars indicate individual spikes. Heatmap (right) shows response amplitude for 25, naturalistic spike trials, using a linear scale where red is maximum amplitude. (C) Connection probability in both conditions in slice and in vivo. (D) Mean EPSP amplitude in response to the first spike in the train, for 1 mM and 2.5 mM Ca2+ conditions in acute brain slice, and in vivo. EPSP amplitude is significantly different only between 1 and 2.5 mM Ca2+. (E) Mean failure rate after the first spike, for all conditions. For all, open circles represent individual cell measurements and filled circles represent all-cell mean± SEM, respectively (D,E).

