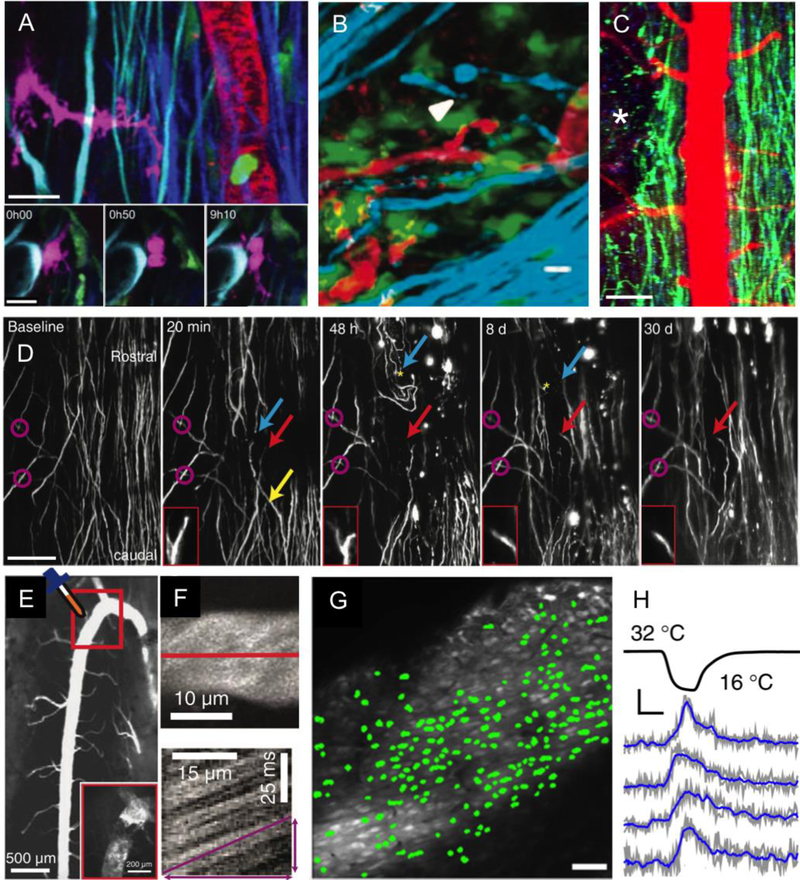
Fig. 3. In vivo two-photon excited fluorescence imaging of cellular structure and function in the mouse spinal cord.
(A) 2PEF imaging of four different fluorescent labels and SHG in mouse spinal cord. (top) Transgenic Thy1-CFP labels dorsal column axons (cyan), transgenic LysM-GFP labels myelo-monocytic cells such as granulocytes and macrophages (green), transgenic CD11c-EYFP labels a subset of dendritic cells, microglia, and macrophages (magenta), intravenously injected fluorescent quantum dots (QDot 655) labels the blood plasma (red), and SHG comes from endogenous collagen in the dura matter (purple). (bottom) Time series showing the division of a CD11c-expressing cell 3 d after a spinal cord injury just rostral to the imaging site. Scale bar = 100 µm and 20 µm in the top and bottom images, respectively. Reproduced from (Fenrich et al., 2013b). (B) Imaging of axons (cyan; transgenic Thy1-CFP), microglia/macrophages (green; transgenic Cx3Cr1-GFP), and fluorescently-tagged fibrinogen (red: intravenously-injected Alexa 594-fibrinogen) in the EAE mouse model of MS. The white arrowhead indicates a degenerating axon. Scale bar = 10 µm. Reproduced from (Davalos, Ryu, et al., 2012). (C) Low-magnification 2PEF imaging of dorsal axons (green; transgenic Thy1-YFP) and blood vessels (red; intravenous Texas Red-dextran) at one day after a pin prick injury to the spinal cord at the location indicated by the white asterisk (unpublished data). Scale bar = 80 µm. (D) Long-term observation of axons (transgenic Thy1-YFP) after a focal, laser injury to the dorsal surface of the spinal cord. Yellow arrow: axon degenerated beyond imaging field; red arrow: axon was stable over course of imaging with axon tip shown in insets; blue arrow: axon slowly died back from lesion; magenta circles: landmarks identified across imaging sessions. Scale bar = 100 µm. Reproduced from (Farrar et al., 2012). (E) Low-magnification 2PEF image of fluorescently-labeled blood vessels, showing the prominence of the dorsal spinal vein. The inset shows the outlined region from the main figure after topical application of FeCl3 to induce clotting. (F) Top image shows a maximum projection of a 2PEF image stack of a venule with fluorescently-labeled blood plasma. Below is a space-time image formed by taking a repeated line scan along the center of the vessel, at the position indicated with the red line in the top image. Moving red blood cells, which do not take up the intravenously injected dye, form dark streaks whose slope is proportion to the inverse of the blood flow speed. E and F reproduced from (Farrar et al., 2015). (G) In vivo 2PEF imaging of OGB-labeled sensory neurons in the spinal cord of an anesthetized mouse. Green overlays indicate neurons that responded to the application of a cooling stimulus to the hind paw. Scale bar = 50 µm. (H) Example traces of the normalized change in fluorescence from OGB-labeled neurons responding to a cooling hind paw stimulus. Scale bar represents 10% ΔF/F and 10 s. G and H reproduced from (Ran et al., 2016).

