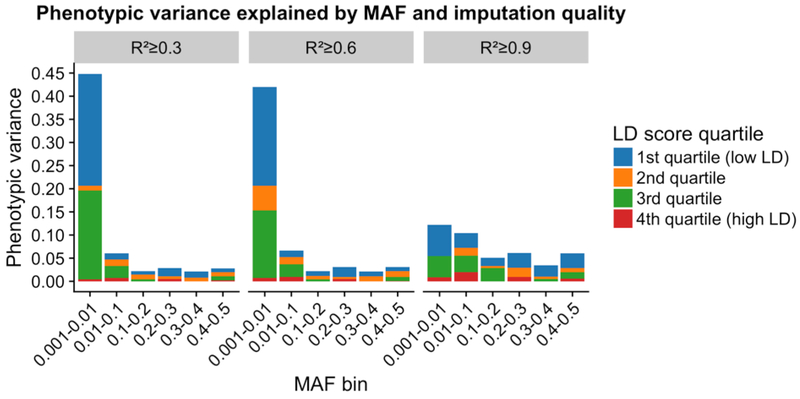
Figure 1:
Estimate of the DLB variance explained by HRC-imputed variants by MAF and LD. Segmental LD score increases from the 1st to 4th quartiles. Negative scores are not shown for simplicity but are present in Supplementary Table 1. The estimates of variance explained are from the GREML-LDMS analyses of fitting all the 24 genetic components simultaneously.

