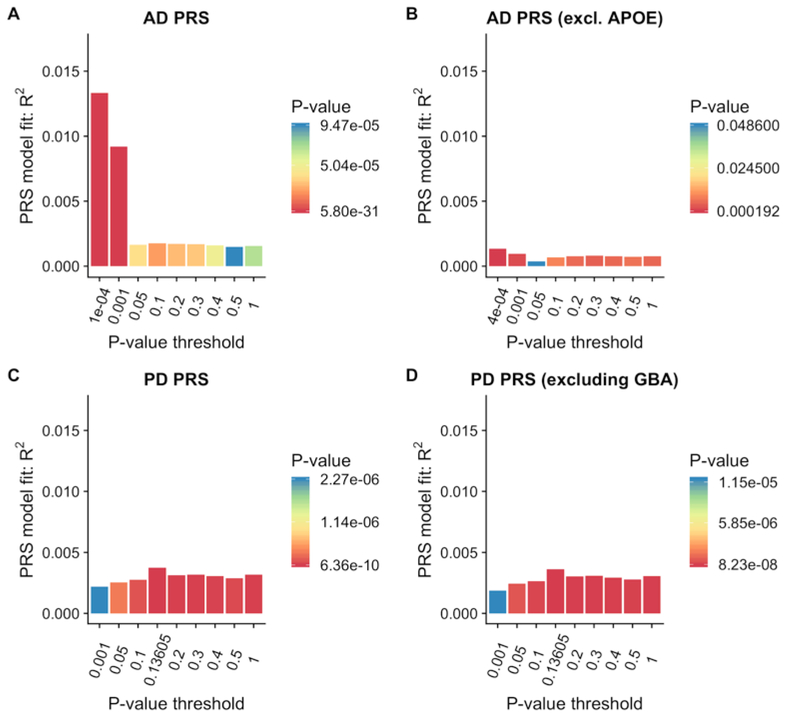
Figure 2:
Proportion of variance of DLB case-control status explained by PRSs from AD (A), AD excluding the APOE locus (B), PD (C) and PD excluding the GBA locus (D). The bars represent PRSs calculated for 9 subsets of markers at different p-value thresholds in the original GWAS publications. Best scores for each PRS are presented in (D). R2: Nagelkerke’s pseudo-R2; Threshold: P-value threshold in original GWAS.

