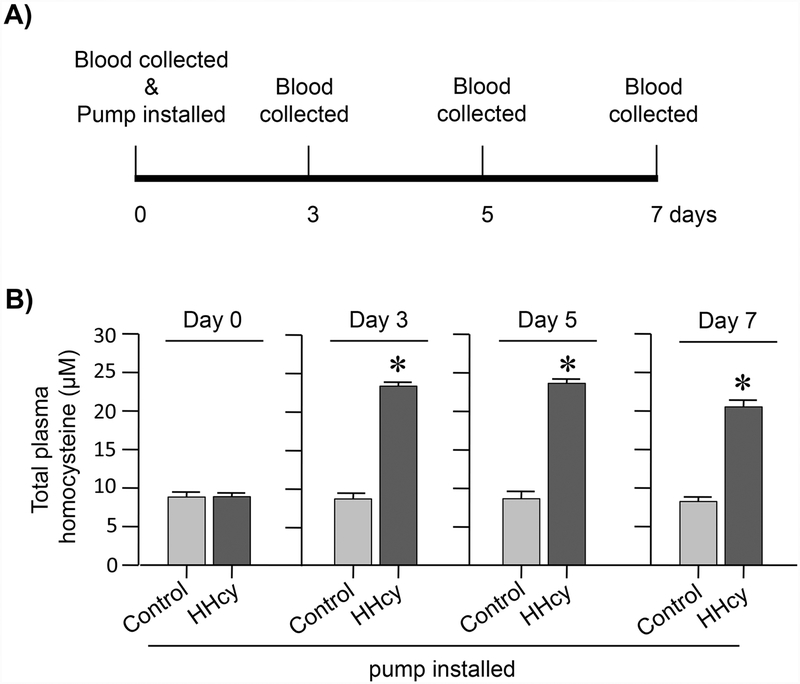
Figure 1. Evaluation of total plasma homocysteine levels in hyperhomocysteinemic rats by HPLC.
(A) Schematic representation of the timeline of implantation of saline or homocysteine containing osmotic pumps and blood collection. (B) Quantitative analysis of total plasma homocysteine levels in rats implanted with saline (control) or homocysteine (HHcy) pumps, before (0 day) and after (3, 5 and 7 days) pump implantation. Values expressed as mean ± SEM (control: n = 4–9, HHcy: n = 7–10). *p < 0.0001 for control vs. HHcy rats.

