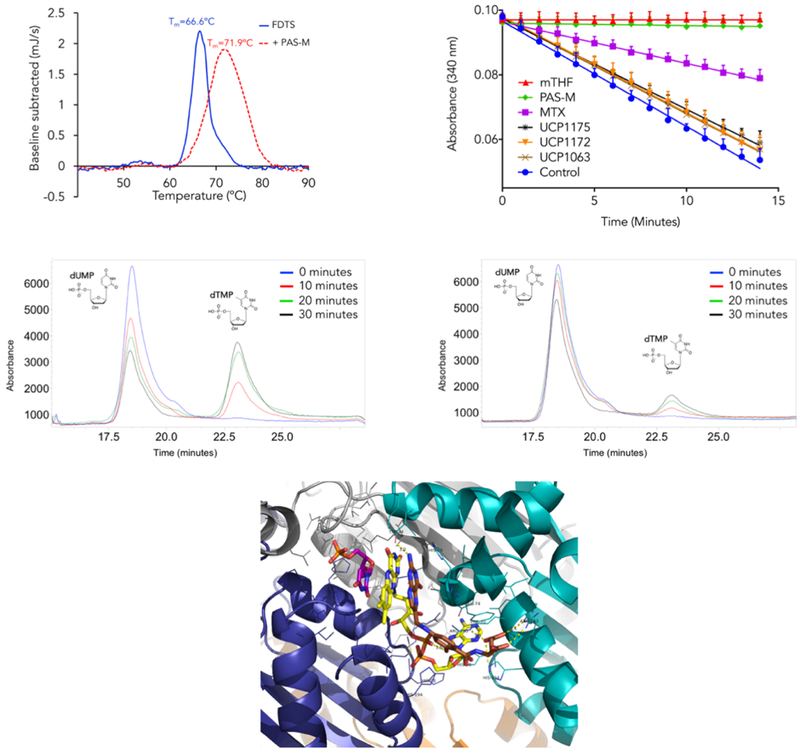
Figure 4.

Top Left: Differential scanning calorimetry analysis of PAS-M binding to Mtb FDTS; Top right: Effect of INCAs, MTX, and PAS-M on the NADPH oxidation activity of Mtb FDTS. Data are presented as means ± SD, in three independent experiments; Middle left: HPLC analysis of Mtb FDTS reaction (uninhibited); Middle right: HPLC analysis of MtbFDTS reaction inhibited by PAS-M; Bottom: Modeling of PAS-M (brown) into the binding pocket of Mtb FDTS in complex with FAD (yellow) and dUMP (magenta)
