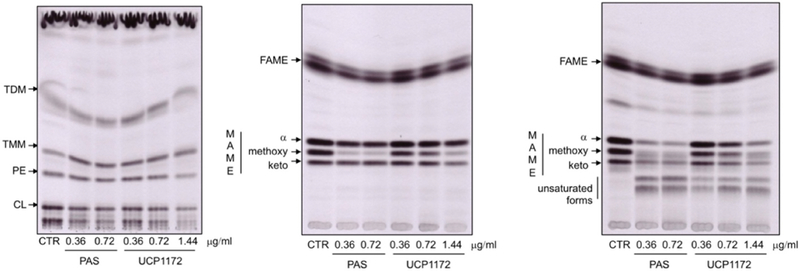
Figure 5.

Left: Autoradiograph of TLC analysis of lipids extracted from 14C acetate labeled Mtb Erdman cells treated with UPC1172, PAS or DMSO as a control (CTR); Autoradiograph of standard (middle) and argentation (right) TLC analysis of methyl esters of fatty and mycolic acids isolated from 14C acetate labeled Mtb Erdman cells treated with UPC1172, PAS, or DMSO as a control (CTR)
